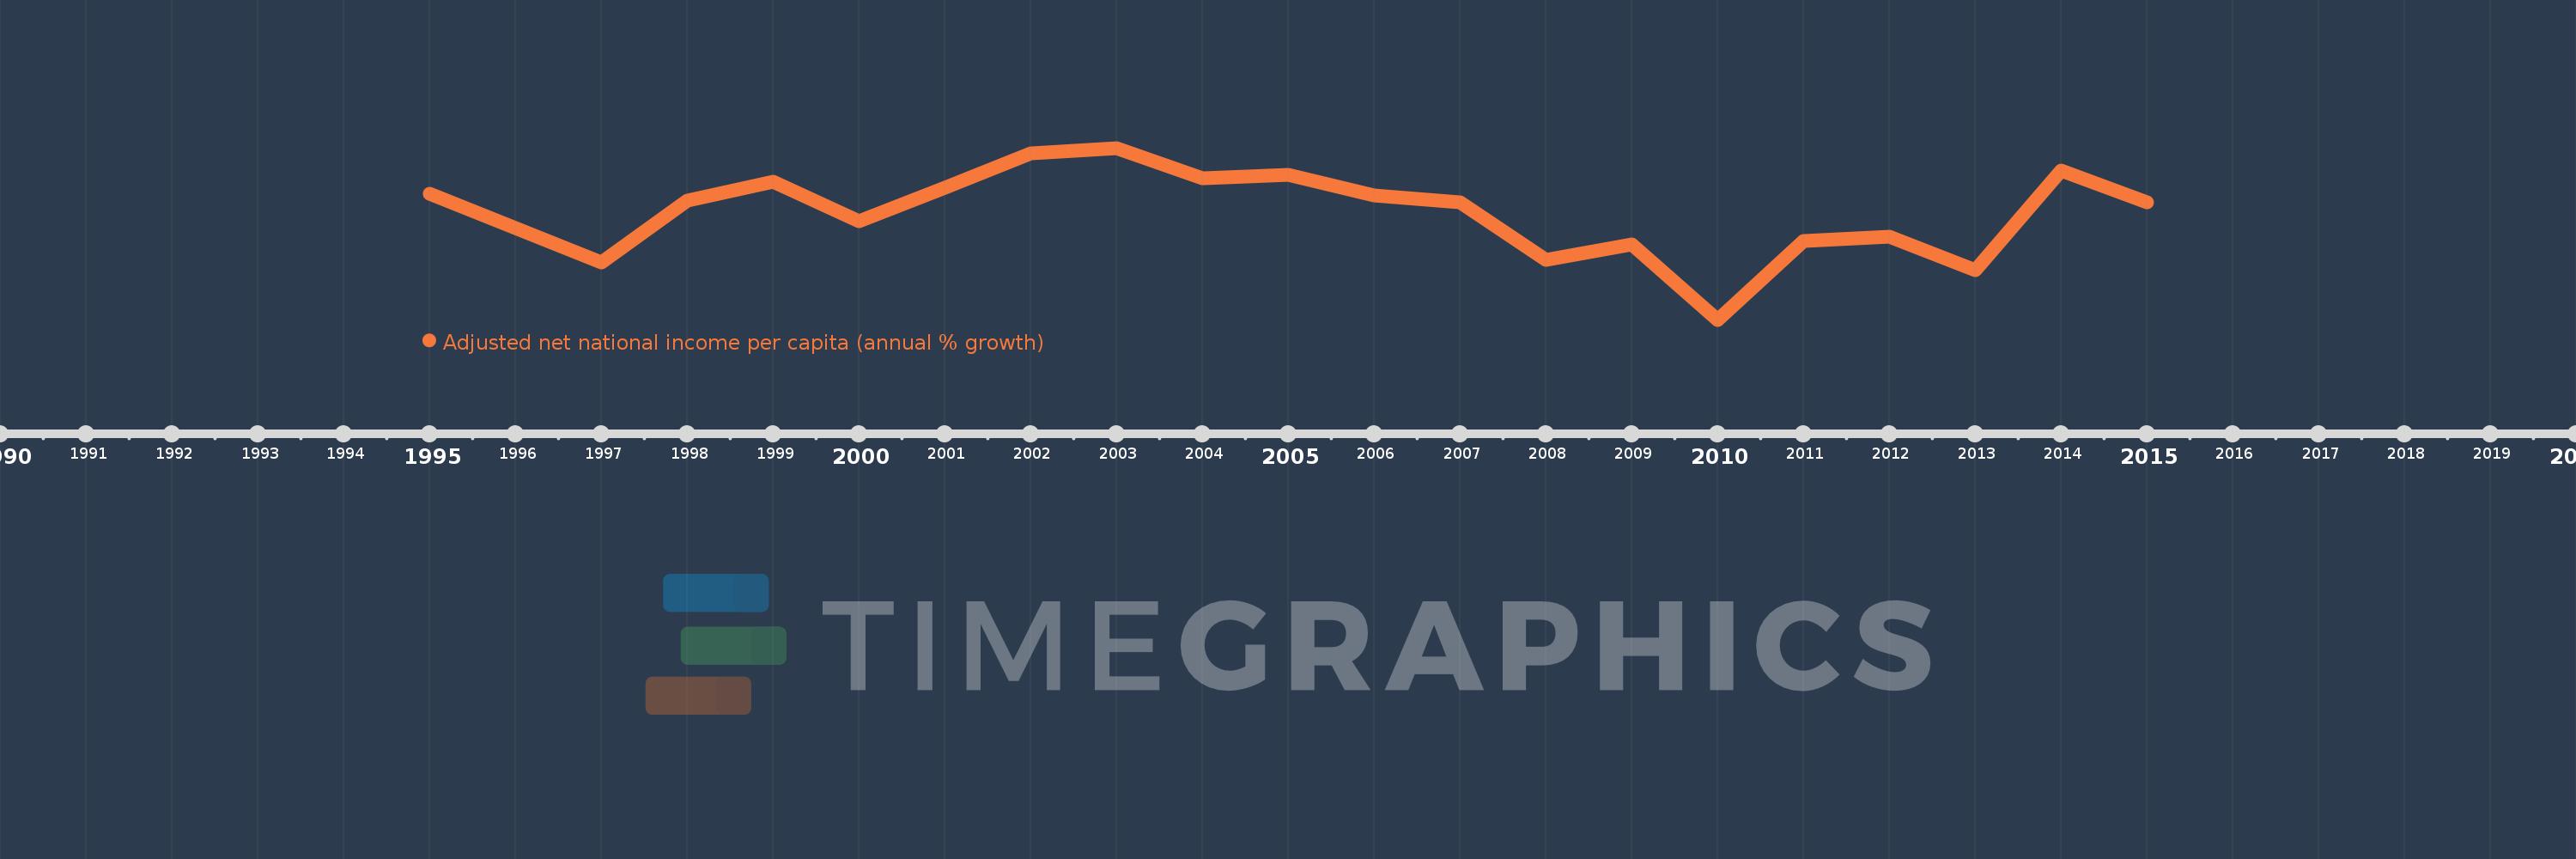
This timeline shows a graph from 1995 to 2015 of Hungary. No data until 1994. Number of actual observations by date: 21.
Source name:
World Development Indicators
Source organization:
World Bank staff estimates based on sources and methods in World Bank's "The Changing Wealth of Nations: Measuring Sustainable Development in the New Millennium" (2011).
Categories, topics:
Economy & Growth
Last updated:
apr 23, 2017
Indicators value changes by year
Meaning:
2.465
Minimum:
-5.219
jan 1, 2010
Maximum:
7.144
jan 1, 2003
At the date of observation
Value
Absolute change
Change from the previous value
jan 1, 1995
3.826
+3.826
0.0%
jan 1, 1996
1.35
-2.476
-64.71%
jan 1, 1997
-1.087
-2.437
-180.53%
jan 1, 1998
3.385
+4.472
-411.32%
jan 1, 1999
4.716
+1.331
39.34%
jan 1, 2000
1.86
-2.856
-60.56%
jan 1, 2001
4.285
+2.426
130.43%
jan 1, 2002
6.727
+2.442
56.97%
jan 1, 2003
7.144
+0.417
6.19%
jan 1, 2004
4.98
-2.163
-30.28%
jan 1, 2005
5.238
+0.258
5.17%
jan 1, 2006
3.716
-1.522
-29.06%
jan 1, 2007
3.233
-0.483
-12.99%
jan 1, 2008
-0.919
-4.152
-128.41%
jan 1, 2009
0.232
+1.151
-125.3%
jan 1, 2010
-5.219
-5.452
-2.35K%
jan 1, 2011
0.464
+5.684
-108.9%
jan 1, 2012
0.763
+0.299
64.37%
jan 1, 2013
-1.652
-2.416
-316.49%
jan 1, 2014
5.521
+7.173
-434.11%
jan 1, 2015
3.202
-2.319
-42.0%
Ranking of countries by current statistics by years
