29
/
en
AIzaSyAYiBZKx7MnpbEhh9jyipgxe19OcubqV5w
April 1, 2024
276327
United States
USA
true
2
1
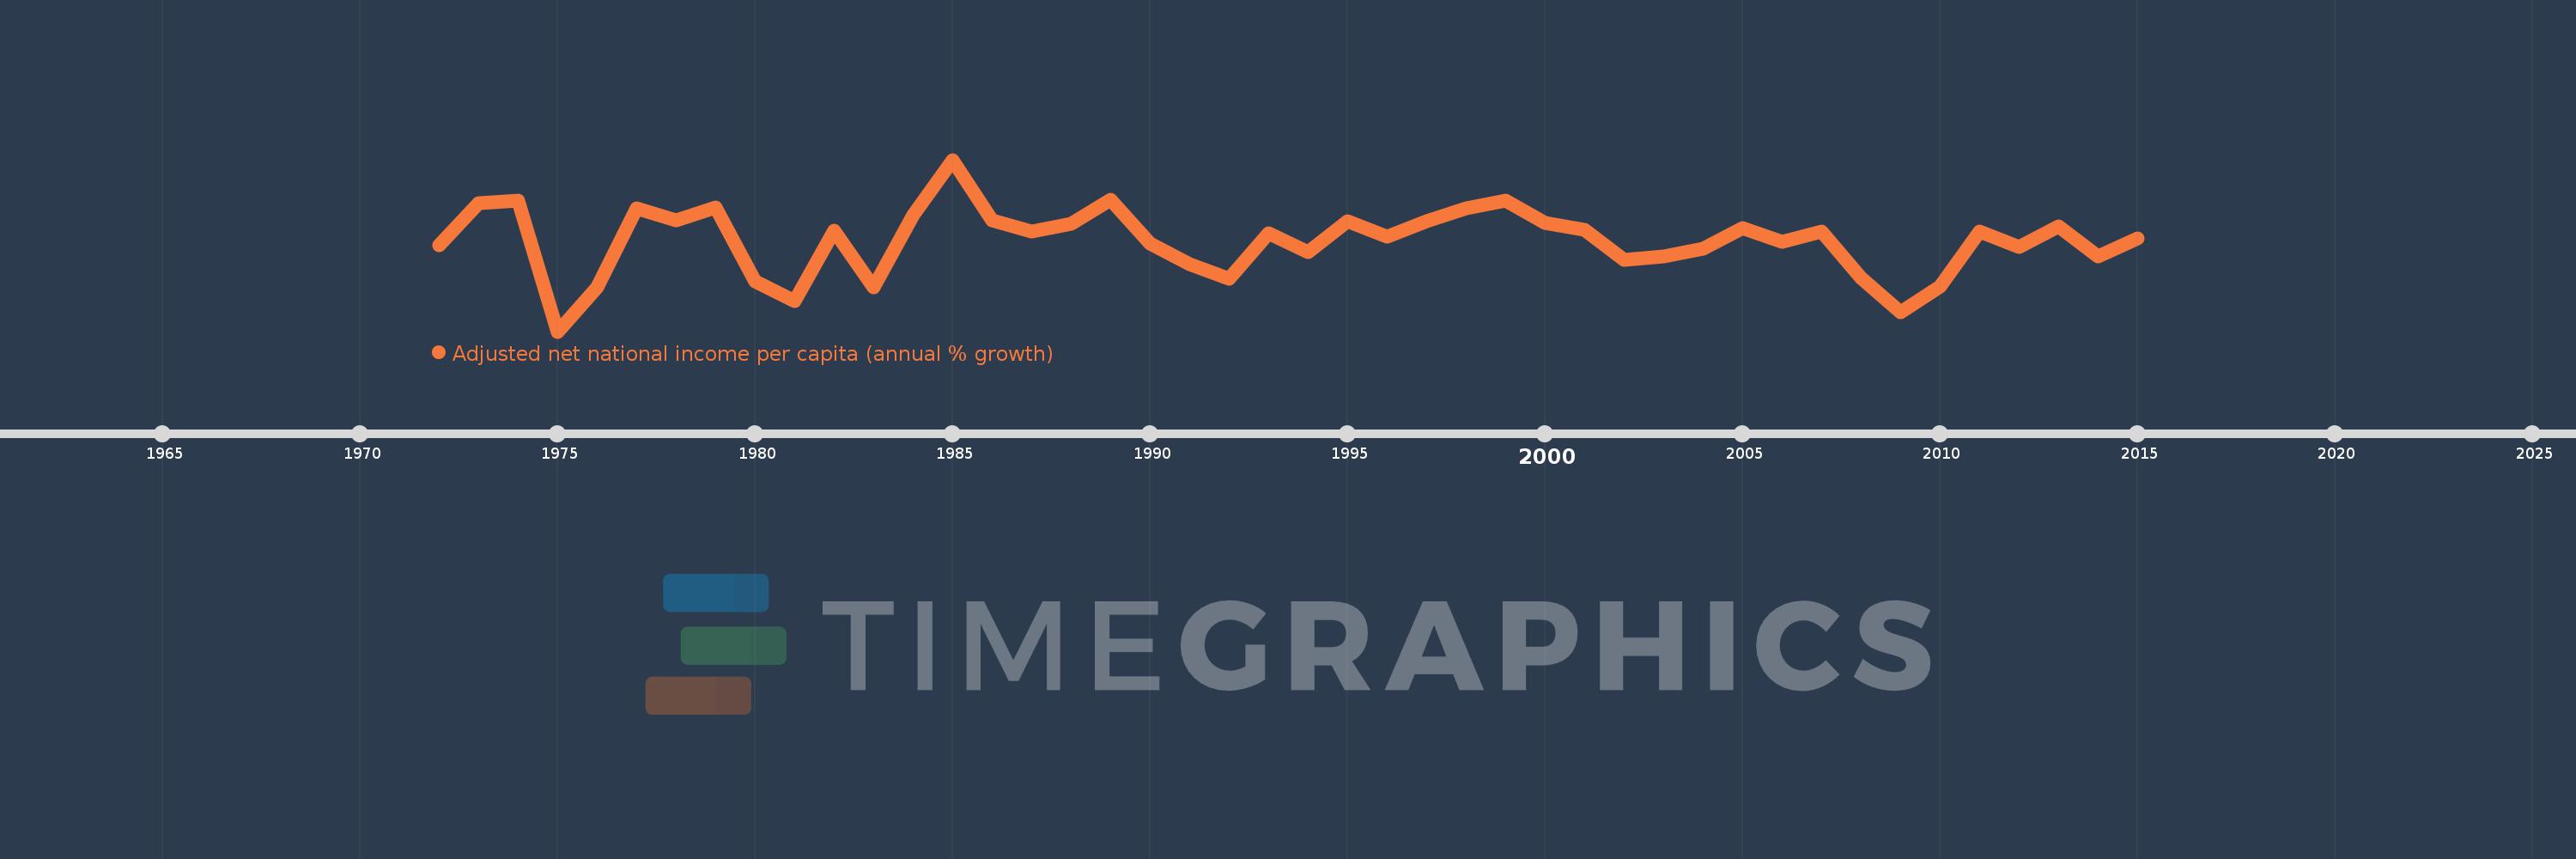
Adjusted net national income per capita (annual % growth)
2015,2014,2013,2012,2011,2010,2009,2008,2007,2006,2005,2004,2003,2002,2001,2000,1999,1998,1997,1996,1995,1994,1993,1992,1991,1990,1989,1988,1987,1986,1985,1984,1983,1982,1981,1980,1979,1978,1977,1976,1975,1974,1973,1972
This statistics in other country:
Timeline:
This timeline shows a graph from 1972 to 2015 of United States. No data until 1971. Number of actual observations by date: 44.
Source name:
World Development Indicators
Source organization:
World Bank staff estimates based on sources and methods in World Bank's "The Changing Wealth of Nations: Measuring Sustainable Development in the New Millennium" (2011).
Categories, topics:
Economy & Growth
Last updated:
apr 23, 2017
Indicators value changes by year
At the date of observation
Value
Absolute change
Change from previous value
jan 1, 1972
1.444
+1.444
0.0%
jan 1, 1973
4.687
+3.243
224.57%
jan 1, 1974
4.844
+0.157
3.35%
jan 1, 1975
-5.19
-10.034
-207.15%
jan 1, 1976
-1.778
+3.412
-65.74%
jan 1, 1977
4.281
+6.059
-340.69%
jan 1, 1978
3.315
-0.965
-22.55%
jan 1, 1979
4.353
+1.038
31.31%
jan 1, 1980
-1.332
-5.685
-130.6%
jan 1, 1981
-2.875
-1.542
115.78%
jan 1, 1982
2.547
+5.421
-188.59%
jan 1, 1983
-1.77
-4.317
-169.51%
jan 1, 1984
3.746
+5.516
-311.59%
jan 1, 1985
7.996
+4.251
113.48%
jan 1, 1986
3.378
-4.618
-57.76%
jan 1, 1987
2.499
-0.879
-26.02%
jan 1, 1988
3.107
+0.608
24.33%
jan 1, 1989
4.924
+1.818
58.51%
jan 1, 1990
1.593
-3.331
-67.65%
jan 1, 1991
-0.016
-1.609
-100.98%
jan 1, 1992
-1.144
-1.128
7.26K%
jan 1, 1993
2.359
+3.502
-306.29%
jan 1, 1994
0.939
-1.42
-60.18%
jan 1, 1995
3.302
+2.363
251.54%
jan 1, 1996
2.096
-1.206
-36.52%
jan 1, 1997
3.263
+1.167
55.7%
jan 1, 1998
4.302
+1.039
31.82%
jan 1, 1999
4.874
+0.572
13.3%
jan 1, 2000
3.169
-1.705
-34.98%
jan 1, 2001
2.594
-0.576
-18.16%
jan 1, 2002
0.3
-2.294
-88.43%
jan 1, 2003
0.61
+0.31
103.17%
jan 1, 2004
1.154
+0.544
89.28%
jan 1, 2005
2.752
+1.599
138.57%
jan 1, 2006
1.696
-1.056
-38.38%
jan 1, 2007
2.507
+0.811
47.81%
jan 1, 2008
-1.07
-3.577
-142.69%
jan 1, 2009
-3.704
-2.634
246.12%
jan 1, 2010
-1.716
+1.988
-53.68%
jan 1, 2011
2.482
+4.198
-244.66%
jan 1, 2012
1.3
-1.182
-47.63%
jan 1, 2013
2.858
+1.559
119.89%
jan 1, 2014
0.589
-2.27
-79.4%
jan 1, 2015
1.971
+1.382
234.72%
Ranking of countries by current statistics by years


Comments: