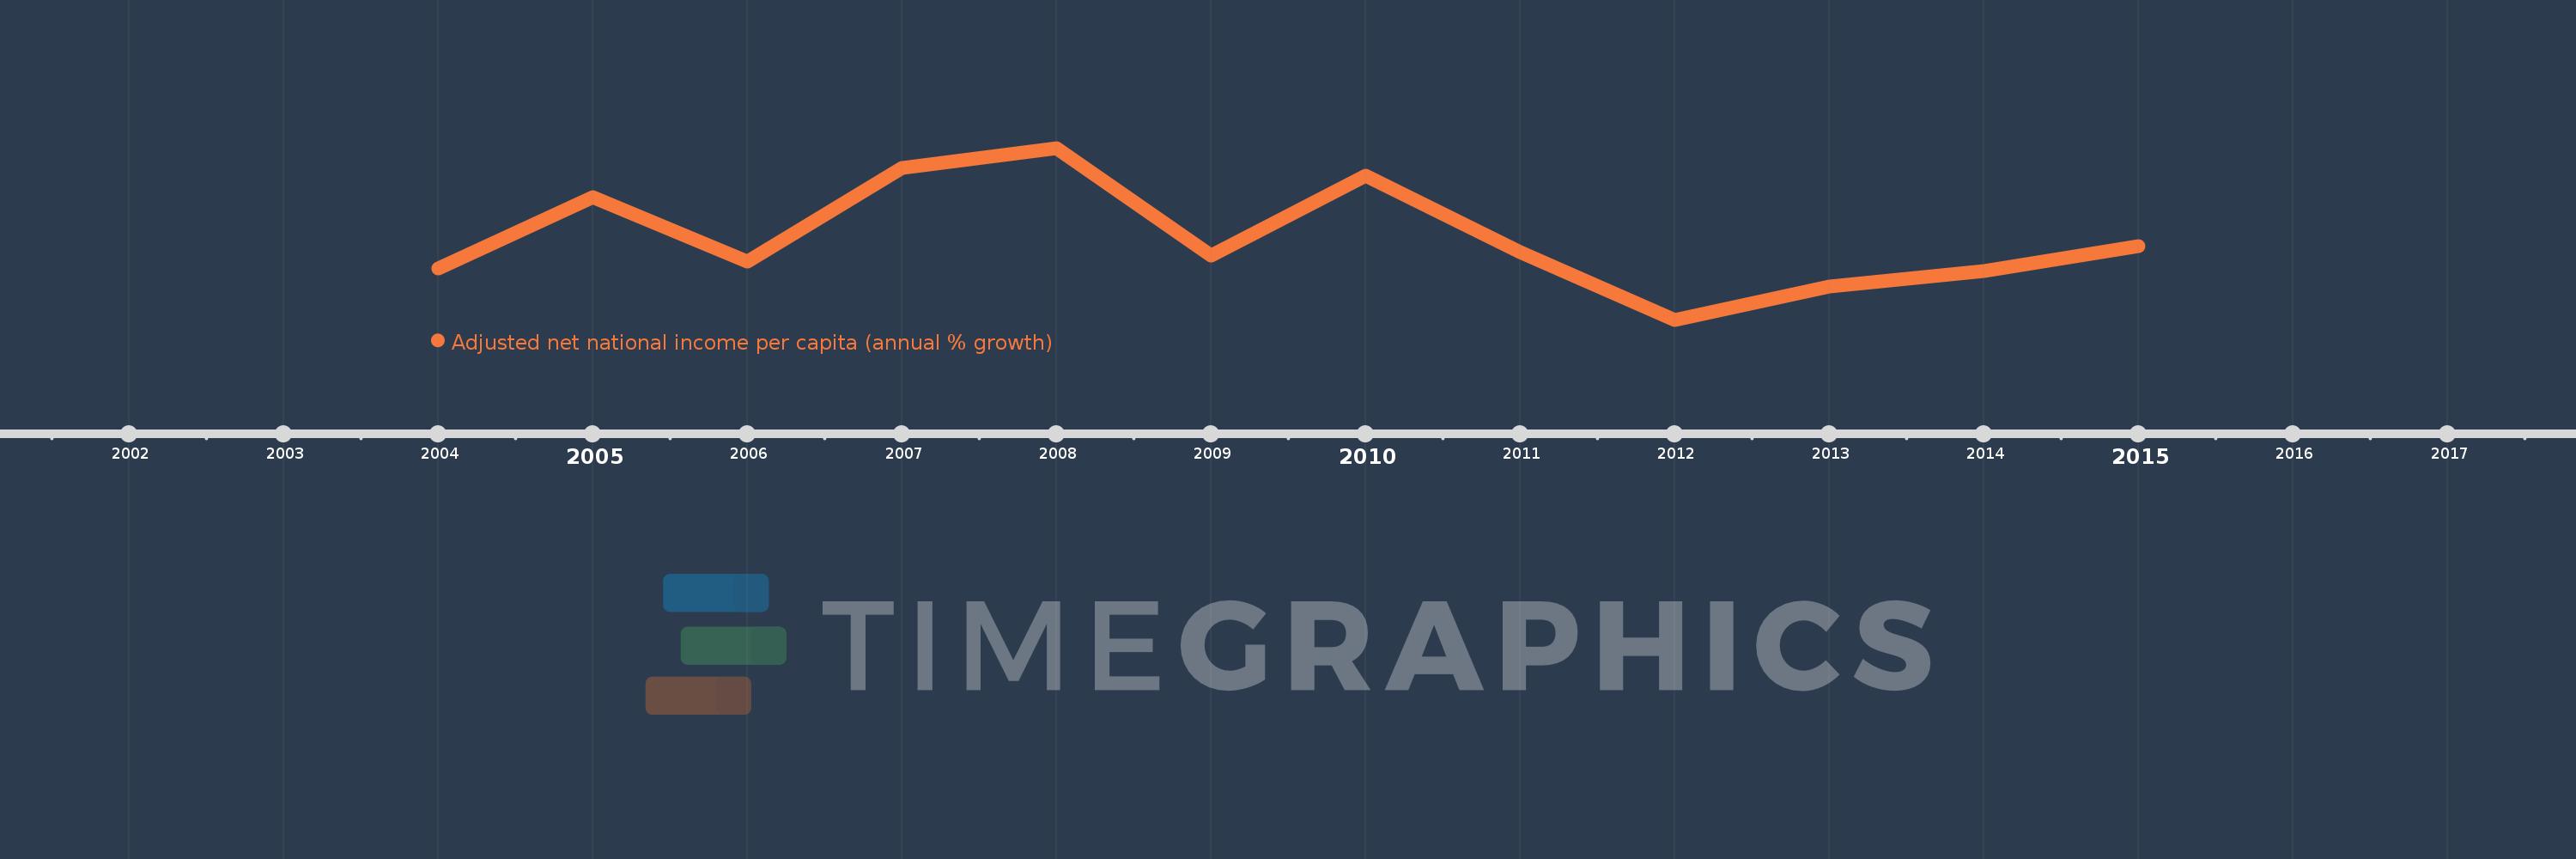
This timeline shows a graph from 2004 to 2015 of Malawi. No data until 2003. Number of actual observations by date: 12.
Source name:
World Development Indicators
Source organization:
World Bank staff estimates based on sources and methods in World Bank's "The Changing Wealth of Nations: Measuring Sustainable Development in the New Millennium" (2011).
Categories, topics:
Economy & Growth
Last updated:
apr 23, 2017
Indicators value changes by year
Meaning:
1.729
Minimum:
-9.729
jan 1, 2012
Maximum:
14.211
jan 1, 2008
At the date of observation
Value
Absolute change
Change from the previous value
jan 1, 2004
-2.549
-2.549
0.0%
jan 1, 2005
7.395
+9.944
-390.07%
jan 1, 2006
-1.681
-9.076
-122.74%
jan 1, 2007
11.421
+13.102
-779.26%
jan 1, 2008
14.211
+2.79
24.42%
jan 1, 2009
-0.809
-15.019
-105.69%
jan 1, 2010
10.382
+11.191
-1.38K%
jan 1, 2011
-0.357
-10.739
-103.44%
jan 1, 2012
-9.729
-9.372
2.62K%
jan 1, 2013
-5.094
+4.635
-47.64%
jan 1, 2014
-2.961
+2.132
-41.86%
jan 1, 2015
0.517
+3.479
-117.46%
Ranking of countries by current statistics by years
