29
/
en
AIzaSyAYiBZKx7MnpbEhh9jyipgxe19OcubqV5w
April 1, 2024
225561
Portugal
PRT
true
2
1
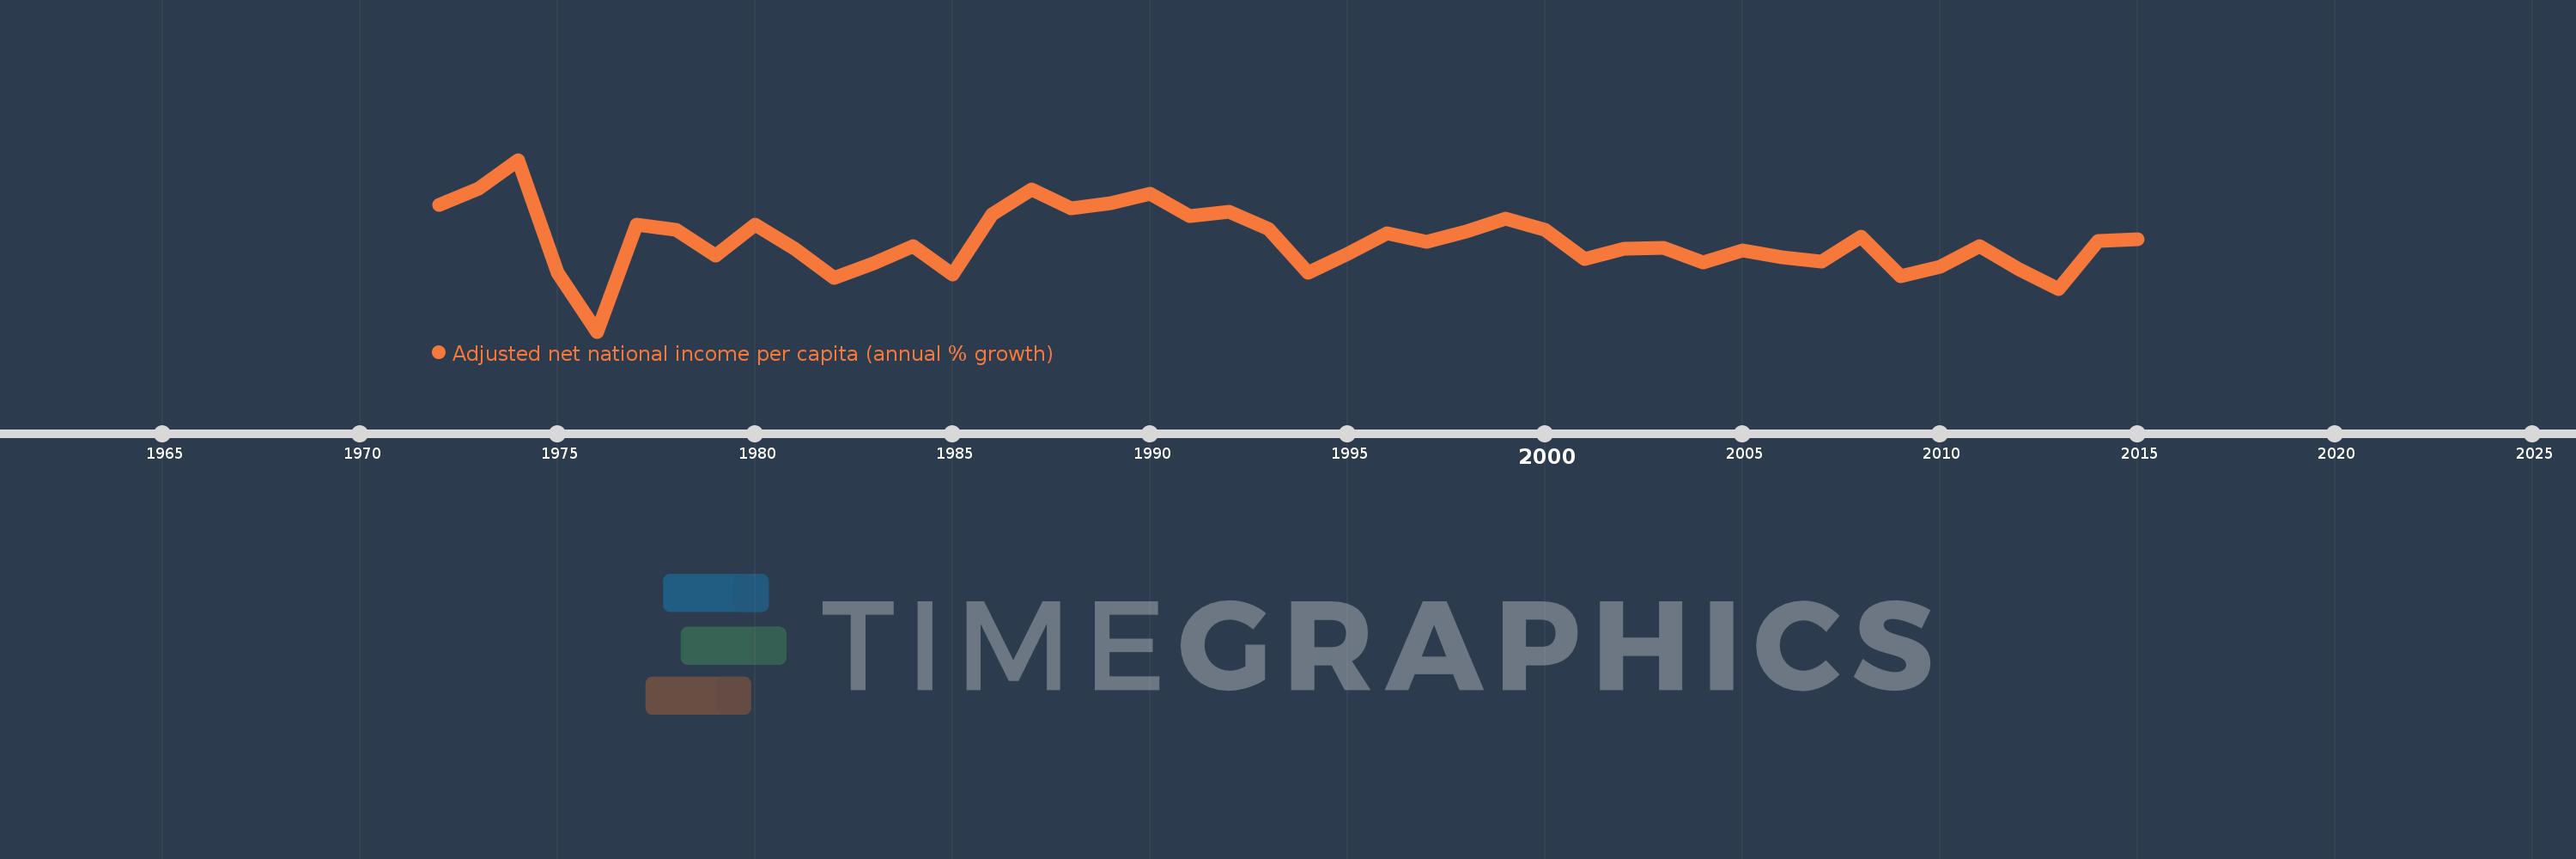
Adjusted net national income per capita (annual % growth)
2015,2014,2013,2012,2011,2010,2009,2008,2007,2006,2005,2004,2003,2002,2001,2000,1999,1998,1997,1996,1995,1994,1993,1992,1991,1990,1989,1988,1987,1986,1985,1984,1983,1982,1981,1980,1979,1978,1977,1976,1975,1974,1973,1972
This statistics in other country:
Timeline:
This timeline shows a graph from 1972 to 2015 of Portugal. No data until 1971. Number of actual observations by date: 44.
Source name:
World Development Indicators
Source organization:
World Bank staff estimates based on sources and methods in World Bank's "The Changing Wealth of Nations: Measuring Sustainable Development in the New Millennium" (2011).
Categories, topics:
Economy & Growth
Last updated:
apr 23, 2017
Indicators value changes by year
Minimum:
-9.881
jan 1, 1976
Maximum:
13.029
jan 1, 1974
At the date of observation
Value
Absolute change
Change from previous value
jan 1, 1972
7.037
+7.037
0.0%
jan 1, 1973
9.239
+2.202
31.29%
jan 1, 1974
13.029
+3.79
41.03%
jan 1, 1975
-2.011
-15.04
-115.43%
jan 1, 1976
-9.881
-7.87
391.36%
jan 1, 1977
4.41
+14.291
-144.63%
jan 1, 1978
3.702
-0.708
-16.06%
jan 1, 1979
0.204
-3.498
-94.49%
jan 1, 1980
4.436
+4.233
2.08K%
jan 1, 1981
1.116
-3.32
-74.83%
jan 1, 1982
-2.766
-3.882
-347.74%
jan 1, 1983
-0.803
+1.963
-70.98%
jan 1, 1984
1.524
+2.327
-289.85%
jan 1, 1985
-2.32
-3.844
-252.27%
jan 1, 1986
5.706
+8.027
-345.91%
jan 1, 1987
9.083
+3.377
59.17%
jan 1, 1988
6.517
-2.566
-28.25%
jan 1, 1989
7.199
+0.682
10.47%
jan 1, 1990
8.548
+1.349
18.74%
jan 1, 1991
5.536
-3.012
-35.23%
jan 1, 1992
6.1
+0.563
10.18%
jan 1, 1993
3.825
-2.275
-37.29%
jan 1, 1994
-2.085
-5.911
-154.52%
jan 1, 1995
0.507
+2.592
-124.31%
jan 1, 1996
3.191
+2.684
529.49%
jan 1, 1997
2.126
-1.064
-33.36%
jan 1, 1998
3.408
+1.282
60.28%
jan 1, 1999
5.194
+1.786
52.4%
jan 1, 2000
3.702
-1.493
-28.74%
jan 1, 2001
-0.212
-3.914
-105.73%
jan 1, 2002
1.229
+1.441
-679.78%
jan 1, 2003
1.233
+0.004
0.3%
jan 1, 2004
-0.652
-1.884
-152.86%
jan 1, 2005
0.967
+1.619
-248.42%
jan 1, 2006
0.06
-0.908
-93.85%
jan 1, 2007
-0.578
-0.637
-1.07K%
jan 1, 2008
2.744
+3.322
-574.85%
jan 1, 2009
-2.523
-5.267
-191.95%
jan 1, 2010
-1.2
+1.323
-52.43%
jan 1, 2011
1.509
+2.709
-225.7%
jan 1, 2012
-1.613
-3.122
-206.93%
jan 1, 2013
-4.242
-2.628
162.89%
jan 1, 2014
2.215
+6.457
-152.22%
jan 1, 2015
2.463
+0.248
11.19%
Ranking of countries by current statistics by years


Comments: