29
/
en
AIzaSyAYiBZKx7MnpbEhh9jyipgxe19OcubqV5w
April 1, 2024
280551
Venezuela, RB
VEN
true
2
1
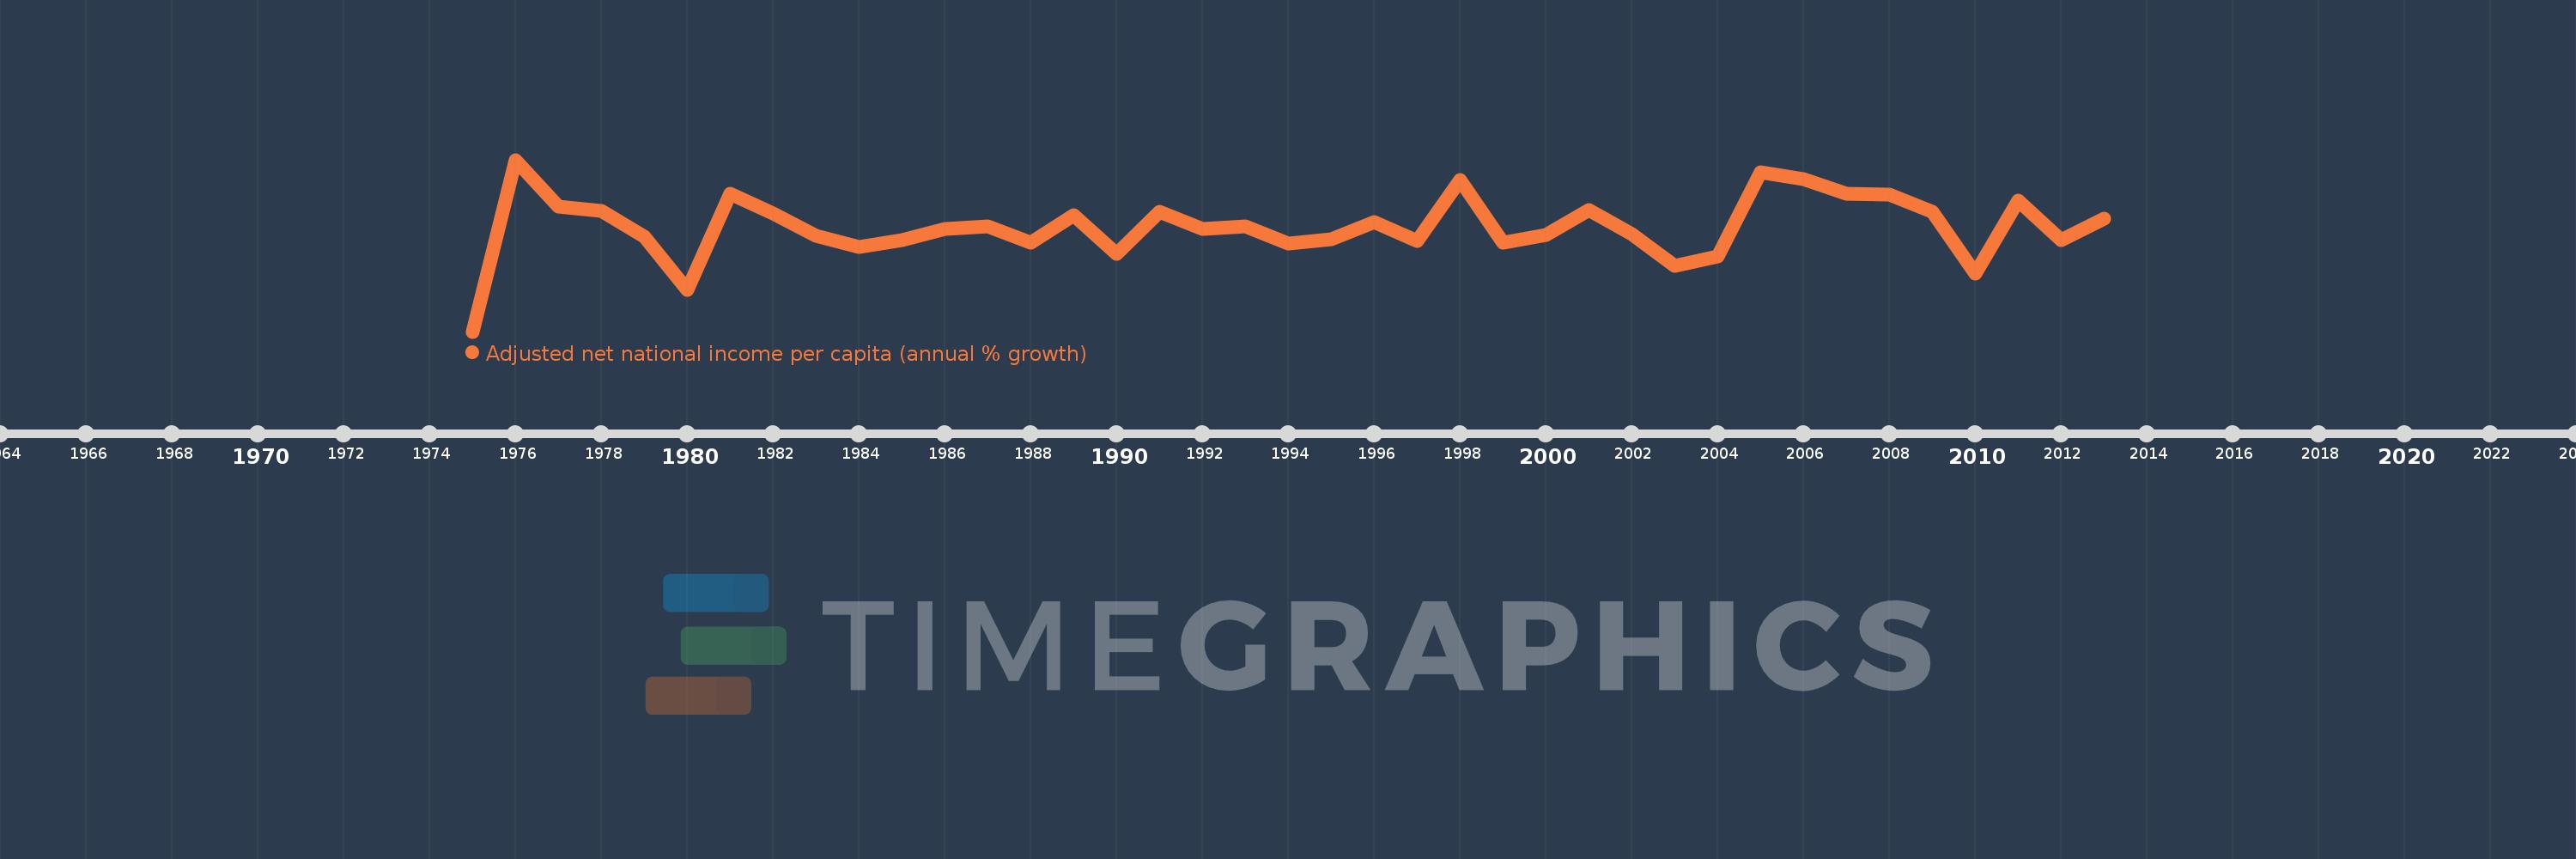
Adjusted net national income per capita (annual % growth)
2013,2012,2011,2010,2009,2008,2007,2006,2005,2004,2003,2002,2001,2000,1999,1998,1997,1996,1995,1994,1993,1992,1991,1990,1989,1988,1987,1986,1985,1984,1983,1982,1981,1980,1979,1978,1977,1976,1975
This statistics in other country:
Timeline:
This timeline shows a graph from 1975 to 2013 of Venezuela, RB. No data until 1974. Number of actual observations by date: 39.
Source name:
World Development Indicators
Source organization:
World Bank staff estimates based on sources and methods in World Bank's "The Changing Wealth of Nations: Measuring Sustainable Development in the New Millennium" (2011).
Categories, topics:
Economy & Growth
Last updated:
apr 23, 2017
Indicators value changes by year
Minimum:
-36.407
jan 1, 1975
Maximum:
26.359
jan 1, 1976
At the date of observation
Value
Absolute change
Change from previous value
jan 1, 1975
-36.407
-36.407
0.0%
jan 1, 1976
26.359
+62.766
-172.4%
jan 1, 1977
9.263
-17.096
-64.86%
jan 1, 1978
7.76
-1.503
-16.23%
jan 1, 1979
-1.667
-9.427
-121.48%
jan 1, 1980
-21.174
-19.507
1.17K%
jan 1, 1981
13.821
+34.995
-165.27%
jan 1, 1982
6.793
-7.028
-50.85%
jan 1, 1983
-1.277
-8.07
-118.8%
jan 1, 1984
-5.402
-4.124
322.88%
jan 1, 1985
-3.004
+2.397
-44.39%
jan 1, 1986
1.049
+4.053
-134.92%
jan 1, 1987
1.887
+0.838
79.9%
jan 1, 1988
-3.882
-5.769
-305.71%
jan 1, 1989
6.239
+10.121
-260.74%
jan 1, 1990
-8.04
-14.279
-228.86%
jan 1, 1991
7.25
+15.29
-190.17%
jan 1, 1992
1.009
-6.241
-86.09%
jan 1, 1993
1.952
+0.943
93.51%
jan 1, 1994
-4.227
-6.179
-316.54%
jan 1, 1995
-2.589
+1.638
-38.75%
jan 1, 1996
3.735
+6.324
-244.25%
jan 1, 1997
-3.146
-6.881
-184.24%
jan 1, 1998
18.976
+22.122
-703.13%
jan 1, 1999
-3.919
-22.895
-120.65%
jan 1, 2000
-1.194
+2.725
-69.53%
jan 1, 2001
7.872
+9.066
-759.31%
jan 1, 2002
-0.918
-8.79
-111.67%
jan 1, 2003
-12.261
-11.342
1.24K%
jan 1, 2004
-8.911
+3.349
-27.32%
jan 1, 2005
21.66
+30.571
-343.06%
jan 1, 2006
19.253
-2.407
-11.11%
jan 1, 2007
13.891
-5.362
-27.85%
jan 1, 2008
13.785
-0.107
-0.77%
jan 1, 2009
7.329
-6.455
-46.83%
jan 1, 2010
-15.171
-22.5
-306.99%
jan 1, 2011
11.566
+26.736
-176.24%
jan 1, 2012
-2.975
-14.54
-125.72%
jan 1, 2013
4.952
+7.926
-266.46%
Ranking of countries by current statistics by years


Comments: