29
/
en
AIzaSyAYiBZKx7MnpbEhh9jyipgxe19OcubqV5w
April 1, 2024
267580
Tunisia
TUN
true
2
1
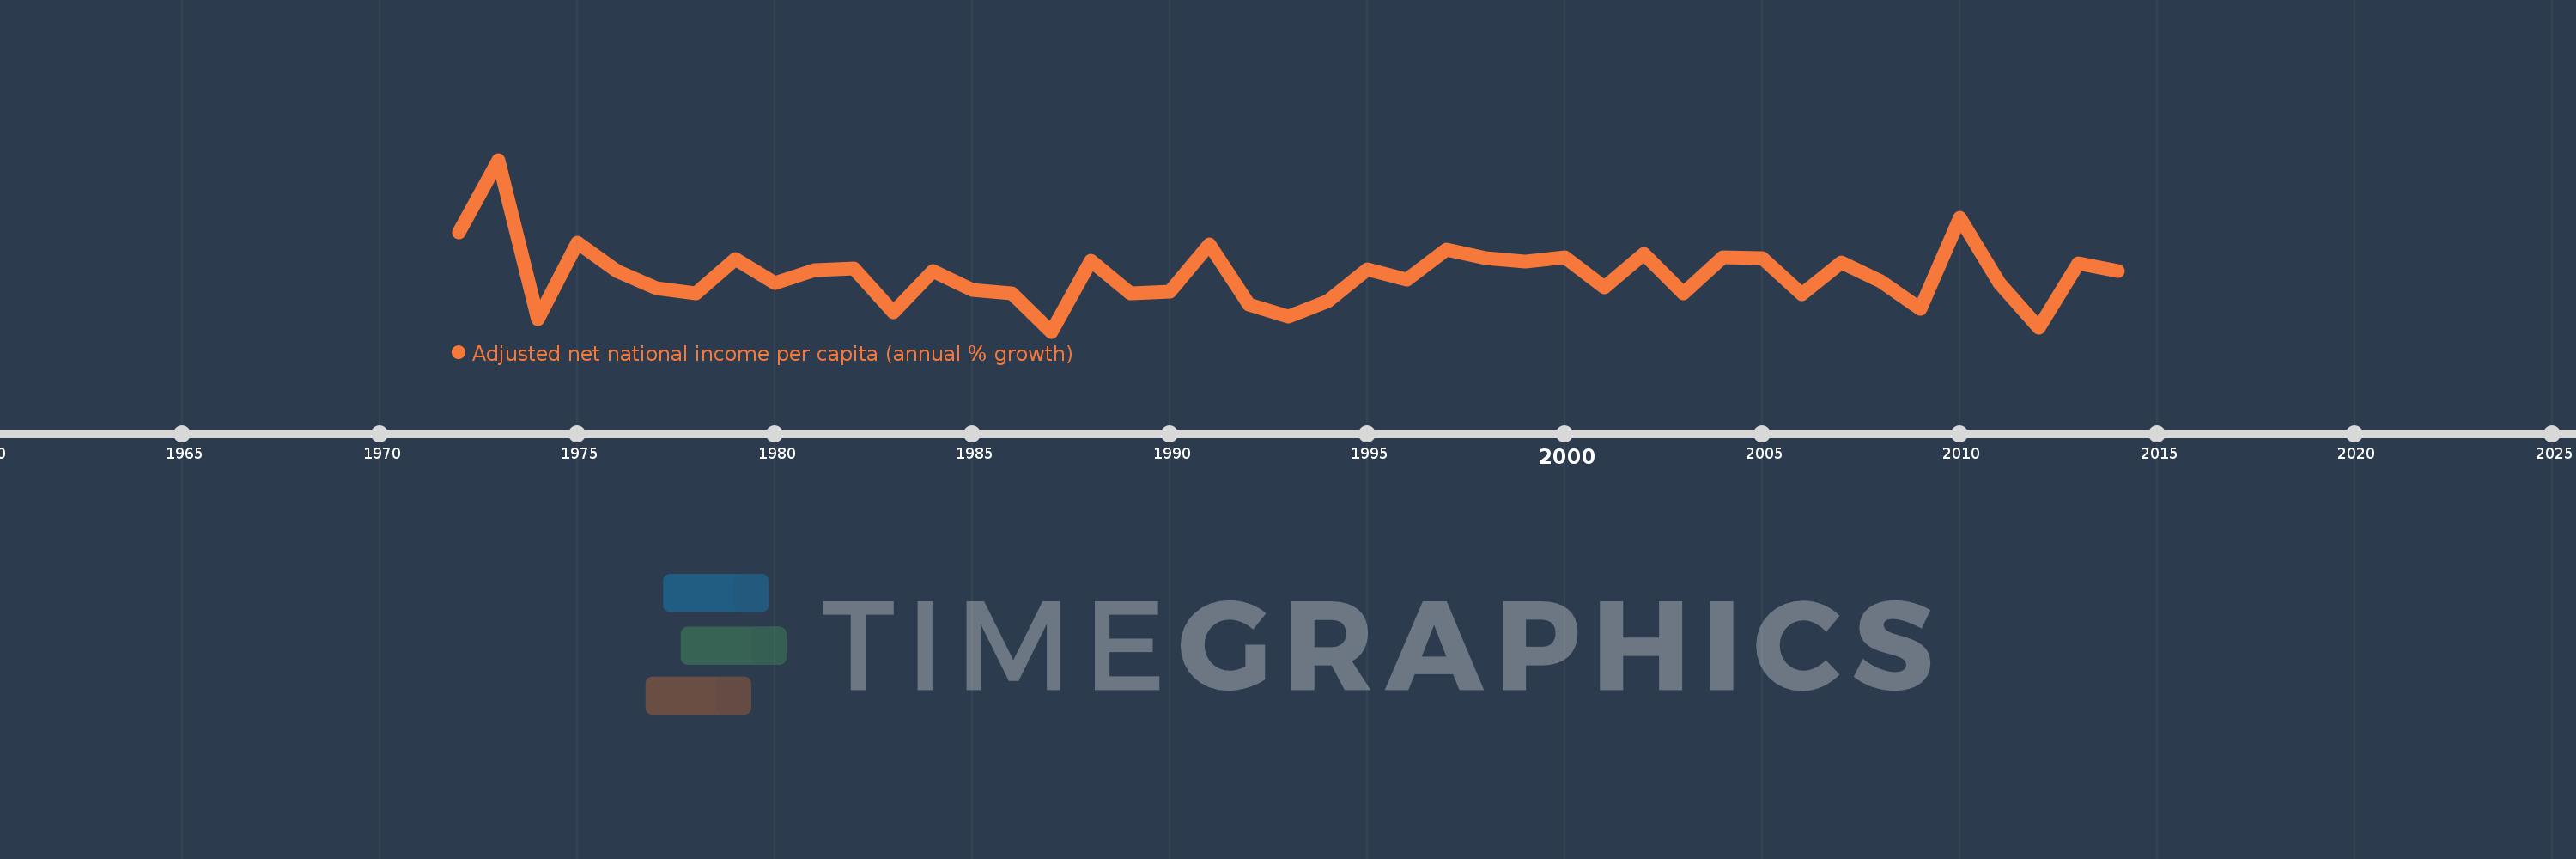
Adjusted net national income per capita (annual % growth)
2014,2013,2012,2011,2010,2009,2008,2007,2006,2005,2004,2003,2002,2001,2000,1999,1998,1997,1996,1995,1994,1993,1992,1991,1990,1989,1988,1987,1986,1985,1984,1983,1982,1981,1980,1979,1978,1977,1976,1975,1974,1973,1972
This statistics in other country:
Timeline:
This timeline shows a graph from 1972 to 2014 of Tunisia. No data until 1971. Number of actual observations by date: 43.
Source name:
World Development Indicators
Source organization:
World Bank staff estimates based on sources and methods in World Bank's "The Changing Wealth of Nations: Measuring Sustainable Development in the New Millennium" (2011).
Categories, topics:
Economy & Growth
Last updated:
apr 23, 2017
Indicators value changes by year
Minimum:
-4.878
jan 1, 1987
Maximum:
17.617
jan 1, 1973
At the date of observation
Value
Absolute change
Change from previous value
jan 1, 1972
8.109
+8.109
0.0%
jan 1, 1973
17.617
+9.508
117.25%
jan 1, 1974
-3.293
-20.91
-118.69%
jan 1, 1975
6.811
+10.104
-306.86%
jan 1, 1976
3.103
-3.708
-54.44%
jan 1, 1977
0.774
-2.329
-75.06%
jan 1, 1978
0.13
-0.644
-83.16%
jan 1, 1979
4.586
+4.456
3.42K%
jan 1, 1980
1.44
-3.145
-68.59%
jan 1, 1981
3.17
+1.73
120.09%
jan 1, 1982
3.358
+0.187
5.9%
jan 1, 1983
-2.328
-5.685
-169.32%
jan 1, 1984
3.095
+5.423
-232.98%
jan 1, 1985
0.594
-2.501
-80.82%
jan 1, 1986
0.14
-0.453
-76.37%
jan 1, 1987
-4.878
-5.019
-3.58K%
jan 1, 1988
4.437
+9.315
-190.95%
jan 1, 1989
0.073
-4.364
-98.35%
jan 1, 1990
0.365
+0.292
398.86%
jan 1, 1991
6.483
+6.118
1.68K%
jan 1, 1992
-1.294
-7.777
-119.95%
jan 1, 1993
-2.914
-1.62
125.25%
jan 1, 1994
-0.897
+2.017
-69.23%
jan 1, 1995
3.239
+4.135
-461.21%
jan 1, 1996
1.956
-1.283
-39.6%
jan 1, 1997
5.882
+3.926
200.69%
jan 1, 1998
4.749
-1.132
-19.25%
jan 1, 1999
4.288
-0.461
-9.71%
jan 1, 2000
4.826
+0.538
12.54%
jan 1, 2001
0.953
-3.873
-80.25%
jan 1, 2002
5.245
+4.292
450.28%
jan 1, 2003
0.163
-5.082
-96.89%
jan 1, 2004
4.897
+4.734
2.91K%
jan 1, 2005
4.713
-0.184
-3.77%
jan 1, 2006
0.02
-4.693
-99.57%
jan 1, 2007
4.165
+4.145
20.5K%
jan 1, 2008
1.744
-2.421
-58.12%
jan 1, 2009
-1.862
-3.606
-206.76%
jan 1, 2010
10.03
+11.892
-638.68%
jan 1, 2011
1.513
-8.517
-84.92%
jan 1, 2012
-4.336
-5.849
-386.63%
jan 1, 2013
4.07
+8.406
-193.87%
jan 1, 2014
3.028
-1.042
-25.61%
Ranking of countries by current statistics by years


Comments: