29
/
en
AIzaSyAYiBZKx7MnpbEhh9jyipgxe19OcubqV5w
April 1, 2024
75893
Bahamas, The
BHS
true
2
1
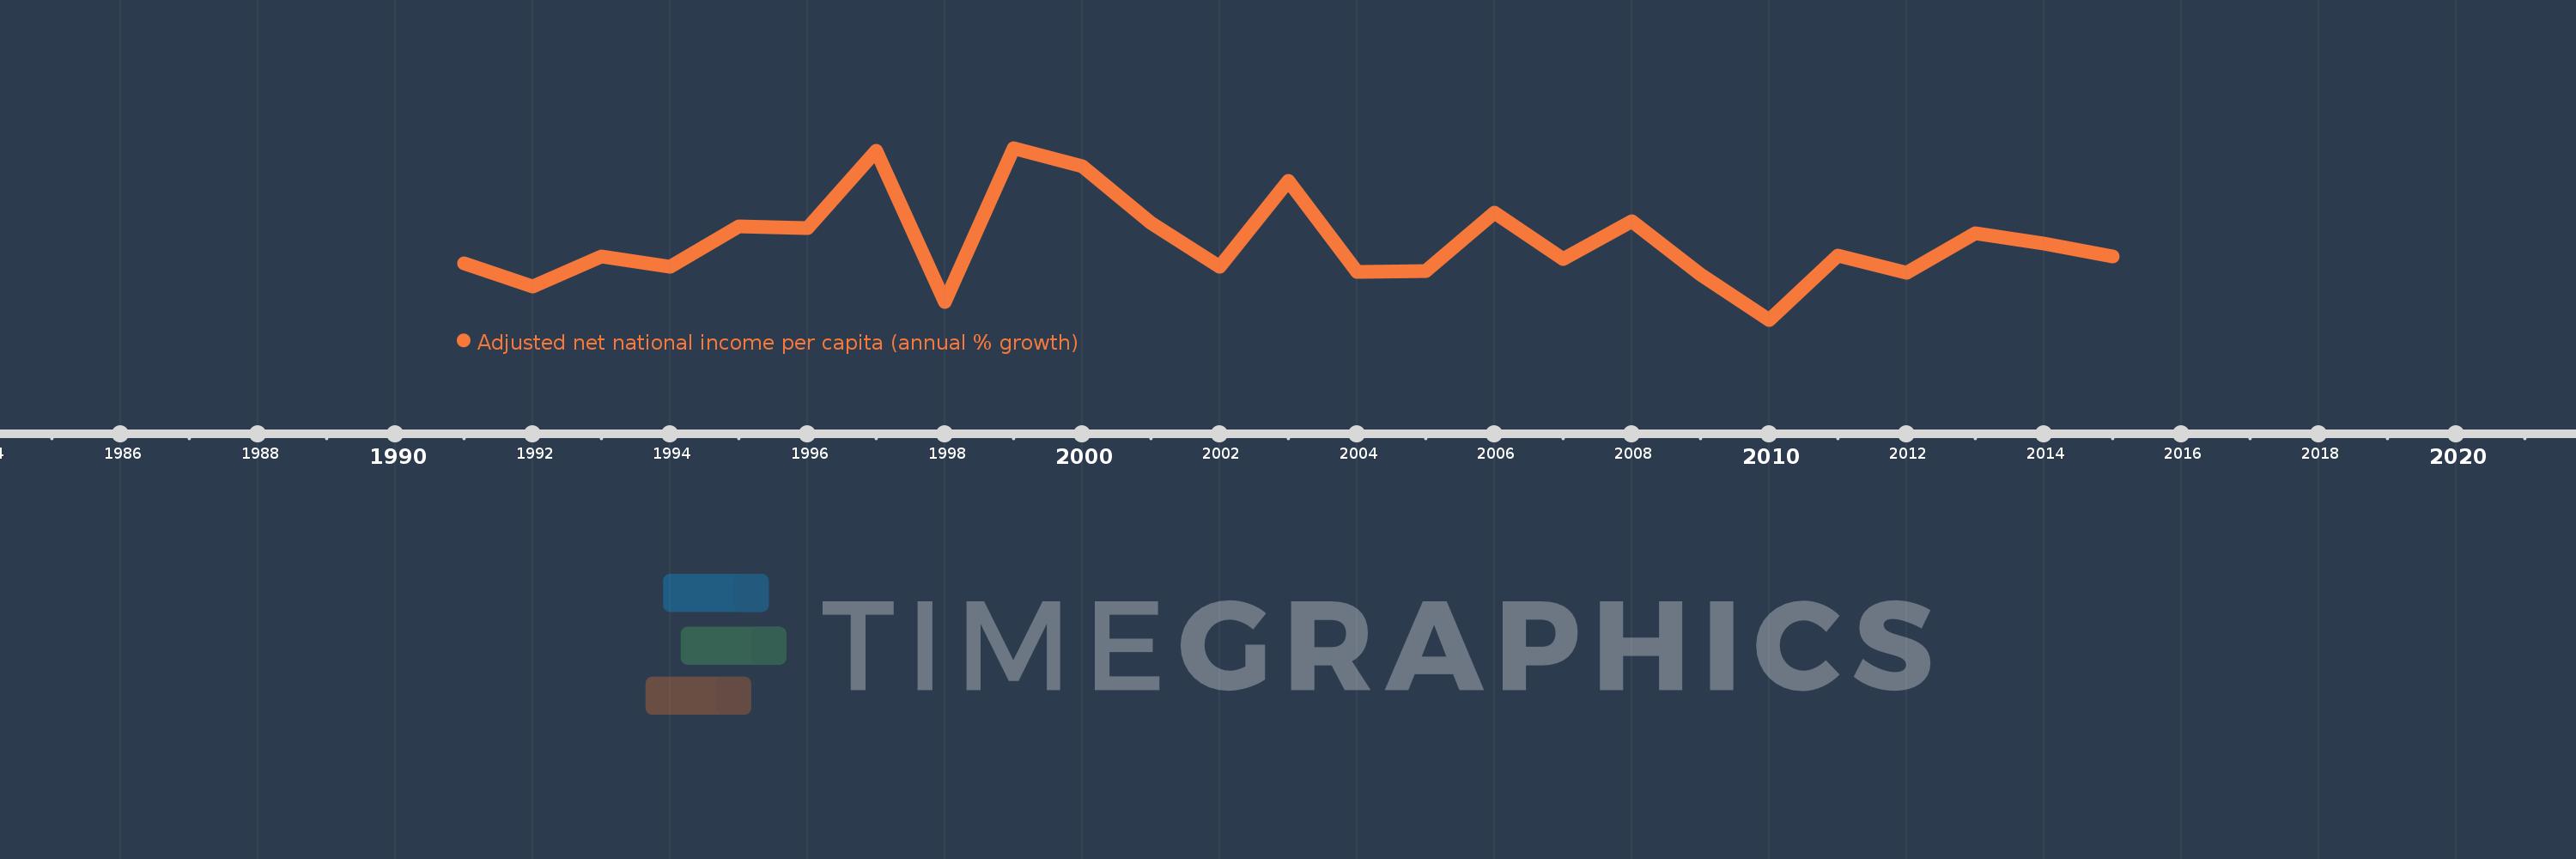
Adjusted net national income per capita (annual % growth)
2015,2014,2013,2012,2011,2010,2009,2008,2007,2006,2005,2004,2003,2002,2001,2000,1999,1998,1997,1996,1995,1994,1993,1992,1991
This statistics in other country:
Timeline:
This timeline shows a graph from 1991 to 2015 of Bahamas, The. No data until 1990. Number of actual observations by date: 25.
Source name:
World Development Indicators
Source organization:
World Bank staff estimates based on sources and methods in World Bank's "The Changing Wealth of Nations: Measuring Sustainable Development in the New Millennium" (2011).
Categories, topics:
Economy & Growth
Last updated:
apr 23, 2017
Indicators value changes by year
Minimum:
-10.831
jan 1, 2010
Maximum:
10.931
jan 1, 1999
At the date of observation
Value
Absolute change
Change from previous value
jan 1, 1991
-3.653
-3.653
0.0%
jan 1, 1992
-6.573
-2.92
79.94%
jan 1, 1993
-2.783
+3.79
-57.66%
jan 1, 1994
-4.067
-1.284
46.12%
jan 1, 1995
1.034
+5.1
-125.42%
jan 1, 1996
0.746
-0.288
-27.82%
jan 1, 1997
10.626
+9.88
1.32K%
jan 1, 1998
-8.573
-19.199
-180.68%
jan 1, 1999
10.931
+19.505
-227.5%
jan 1, 2000
8.608
-2.323
-21.25%
jan 1, 2001
1.38
-7.228
-83.97%
jan 1, 2002
-4.119
-5.498
-398.51%
jan 1, 2003
6.765
+10.884
-264.26%
jan 1, 2004
-4.789
-11.555
-170.79%
jan 1, 2005
-4.615
+0.174
-3.64%
jan 1, 2006
2.761
+7.376
-159.83%
jan 1, 2007
-3.096
-5.857
-212.14%
jan 1, 2008
1.637
+4.733
-152.87%
jan 1, 2009
-5.083
-6.72
-410.56%
jan 1, 2010
-10.831
-5.748
113.07%
jan 1, 2011
-2.68
+8.151
-75.26%
jan 1, 2012
-4.876
-2.196
81.95%
jan 1, 2013
0.08
+4.956
-101.64%
jan 1, 2014
-1.227
-1.307
-1.63K%
jan 1, 2015
-2.798
-1.571
128.06%
Ranking of countries by current statistics by years


Comments: