29
/
en
AIzaSyAYiBZKx7MnpbEhh9jyipgxe19OcubqV5w
April 1, 2024
183467
Macedonia, FYR
MKD
true
2
1
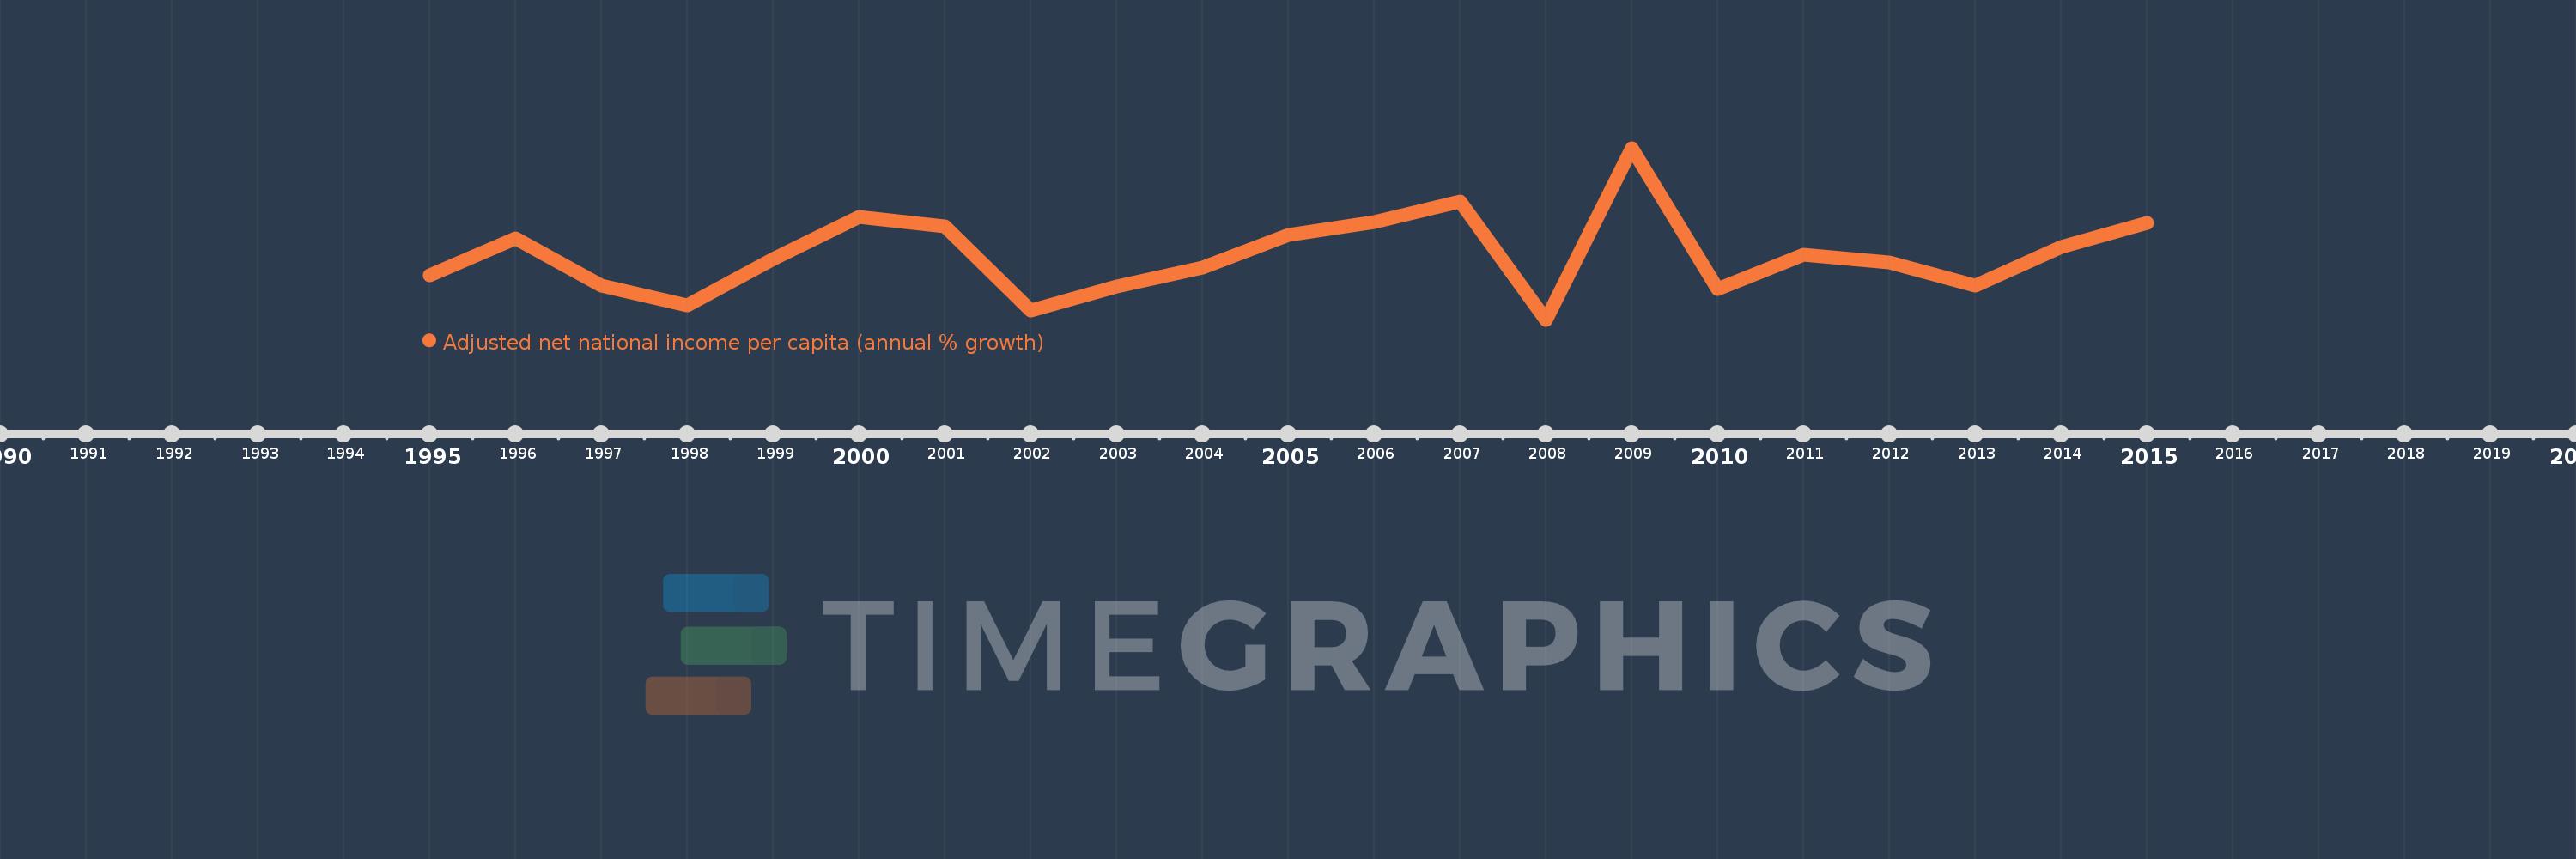
Adjusted net national income per capita (annual % growth)
2015,2014,2013,2012,2011,2010,2009,2008,2007,2006,2005,2004,2003,2002,2001,2000,1999,1998,1997,1996,1995
This statistics in other country:
Timeline:
This timeline shows a graph from 1995 to 2015 of Macedonia, FYR. No data until 1994. Number of actual observations by date: 21.
Source name:
World Development Indicators
Source organization:
World Bank staff estimates based on sources and methods in World Bank's "The Changing Wealth of Nations: Measuring Sustainable Development in the New Millennium" (2011).
Categories, topics:
Economy & Growth
Last updated:
apr 23, 2017
Indicators value changes by year
Minimum:
-2.513
jan 1, 2008
Maximum:
10.664
jan 1, 2009
At the date of observation
Value
Absolute change
Change from previous value
jan 1, 1995
0.871
+0.871
0.0%
jan 1, 1996
3.716
+2.844
326.39%
jan 1, 1997
0.107
-3.609
-97.13%
jan 1, 1998
-1.402
-1.509
-1.41K%
jan 1, 1999
2.137
+3.539
-252.39%
jan 1, 2000
5.389
+3.252
152.21%
jan 1, 2001
4.672
-0.717
-13.3%
jan 1, 2002
-1.838
-6.51
-139.33%
jan 1, 2003
0.028
+1.865
-101.51%
jan 1, 2004
1.505
+1.477
5.32K%
jan 1, 2005
3.986
+2.481
164.87%
jan 1, 2006
4.983
+0.997
25.0%
jan 1, 2007
6.54
+1.557
31.25%
jan 1, 2008
-2.513
-9.053
-138.42%
jan 1, 2009
10.664
+13.177
-524.44%
jan 1, 2010
-0.172
-10.836
-101.61%
jan 1, 2011
2.504
+2.676
-1.56K%
jan 1, 2012
1.912
-0.592
-23.63%
jan 1, 2013
0.093
-1.819
-95.14%
jan 1, 2014
3.073
+2.98
3.2K%
jan 1, 2015
4.935
+1.861
60.57%
Ranking of countries by current statistics by years


Comments: