29
/
en
AIzaSyAYiBZKx7MnpbEhh9jyipgxe19OcubqV5w
April 1, 2024
271812
Uganda
UGA
true
2
1
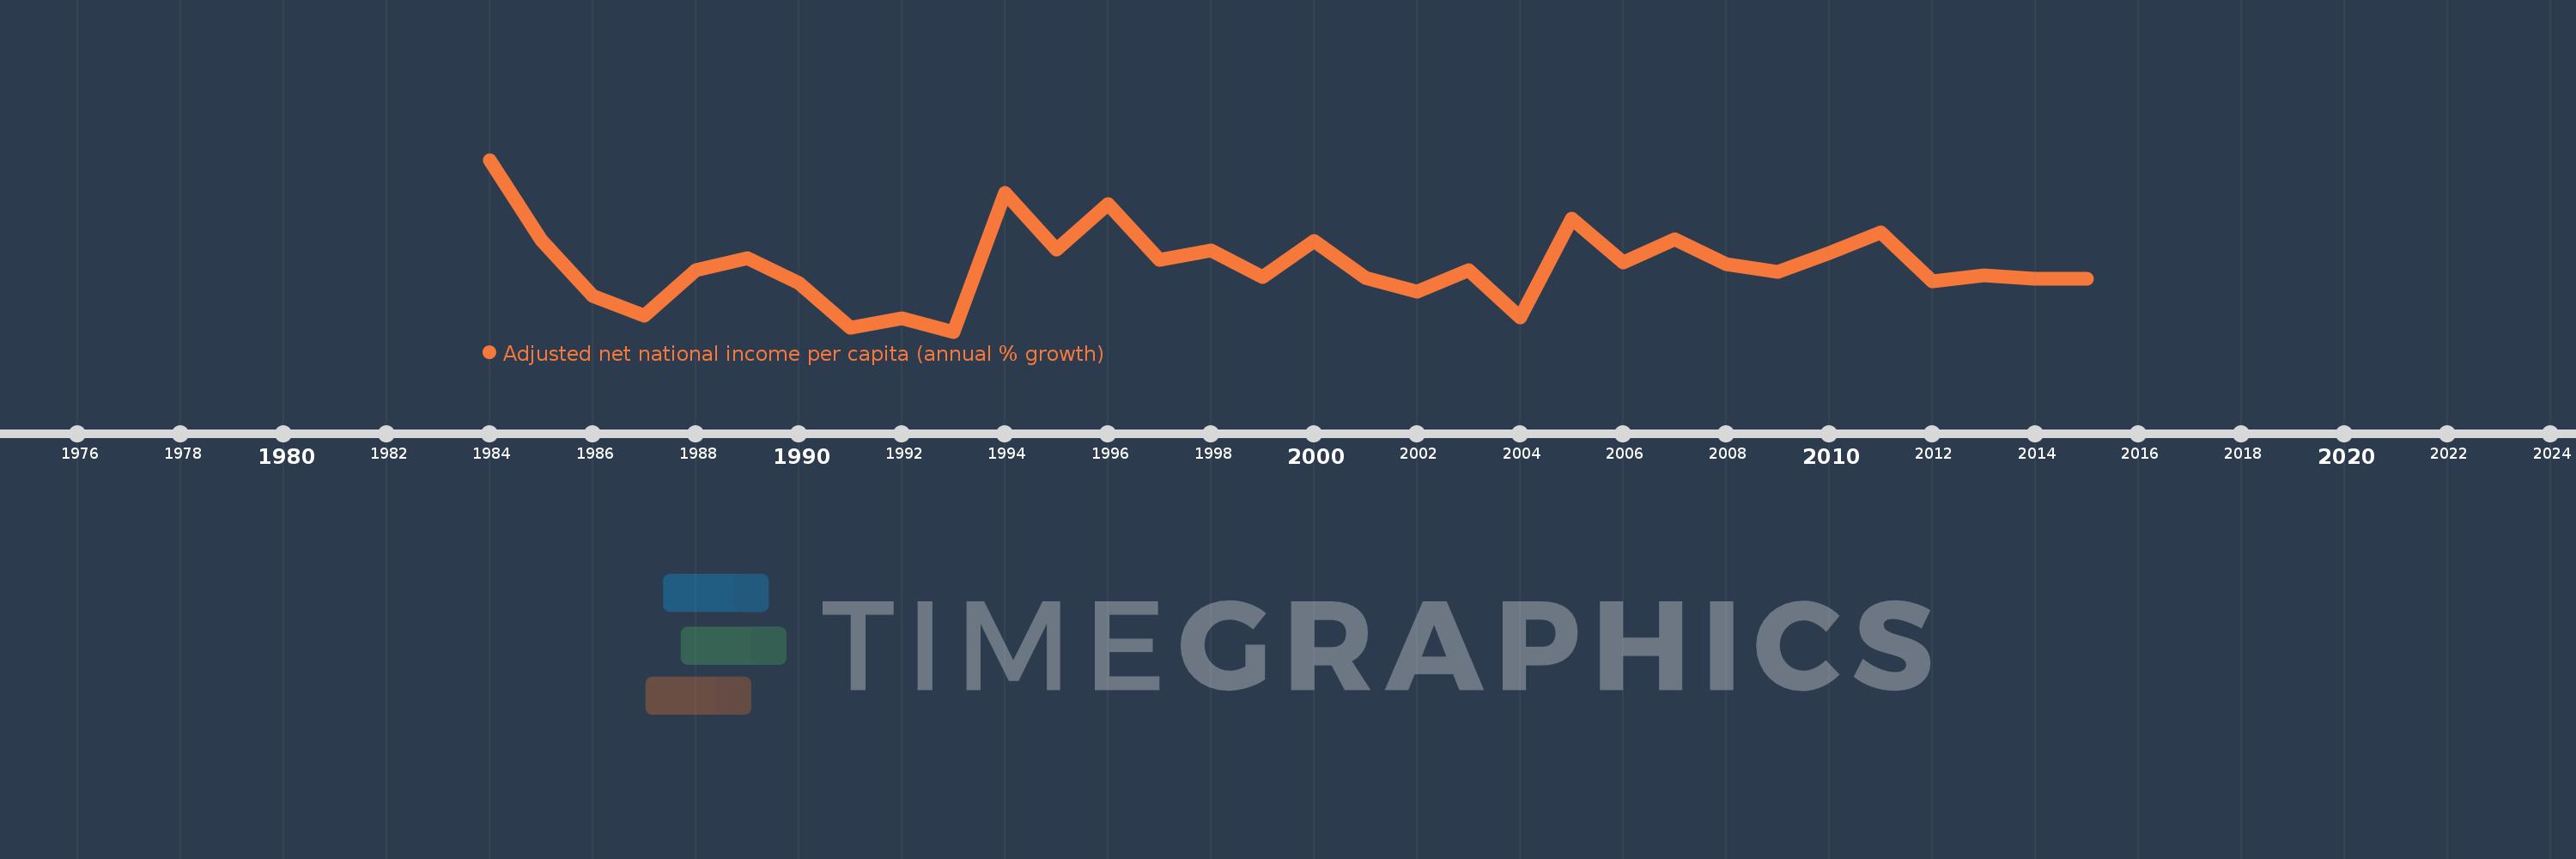
Adjusted net national income per capita (annual % growth)
2015,2014,2013,2012,2011,2010,2009,2008,2007,2006,2005,2004,2003,2002,2001,2000,1999,1998,1997,1996,1995,1994,1993,1992,1991,1990,1989,1988,1987,1986,1985,1984
This statistics in other country:
Timeline:
This timeline shows a graph from 1984 to 2015 of Uganda. No data until 1983. Number of actual observations by date: 32.
Source name:
World Development Indicators
Source organization:
World Bank staff estimates based on sources and methods in World Bank's "The Changing Wealth of Nations: Measuring Sustainable Development in the New Millennium" (2011).
Categories, topics:
Economy & Growth
Last updated:
apr 23, 2017
Indicators value changes by year
Minimum:
-10.112
jan 1, 1993
Maximum:
24.582
jan 1, 1984
At the date of observation
Value
Absolute change
Change from previous value
jan 1, 1984
24.582
+24.582
0.0%
jan 1, 1985
8.43
-16.151
-65.71%
jan 1, 1986
-2.985
-11.415
-135.41%
jan 1, 1987
-6.942
-3.957
132.55%
jan 1, 1988
2.37
+9.312
-134.14%
jan 1, 1989
4.72
+2.35
99.16%
jan 1, 1990
-0.346
-5.067
-107.34%
jan 1, 1991
-9.37
-9.023
2.6K%
jan 1, 1992
-7.34
+2.029
-21.66%
jan 1, 1993
-10.112
-2.772
37.76%
jan 1, 1994
17.865
+27.977
-276.67%
jan 1, 1995
6.491
-11.375
-63.67%
jan 1, 1996
15.636
+9.146
140.91%
jan 1, 1997
4.408
-11.228
-71.81%
jan 1, 1998
6.242
+1.833
41.58%
jan 1, 1999
0.988
-5.253
-84.16%
jan 1, 2000
8.237
+7.249
733.36%
jan 1, 2001
0.665
-7.572
-91.92%
jan 1, 2002
-2.058
-2.723
-409.25%
jan 1, 2003
2.253
+4.311
-209.47%
jan 1, 2004
-7.291
-9.544
-423.62%
jan 1, 2005
12.633
+19.924
-273.27%
jan 1, 2006
3.84
-8.793
-69.61%
jan 1, 2007
8.483
+4.644
120.94%
jan 1, 2008
3.493
-4.99
-58.83%
jan 1, 2009
1.879
-1.614
-46.2%
jan 1, 2010
5.834
+3.954
210.43%
jan 1, 2011
9.849
+4.016
68.84%
jan 1, 2012
0.044
-9.805
-99.55%
jan 1, 2013
1.263
+1.219
2.75K%
jan 1, 2014
0.487
-0.776
-61.42%
jan 1, 2015
0.565
+0.078
15.94%
Ranking of countries by current statistics by years


Comments: