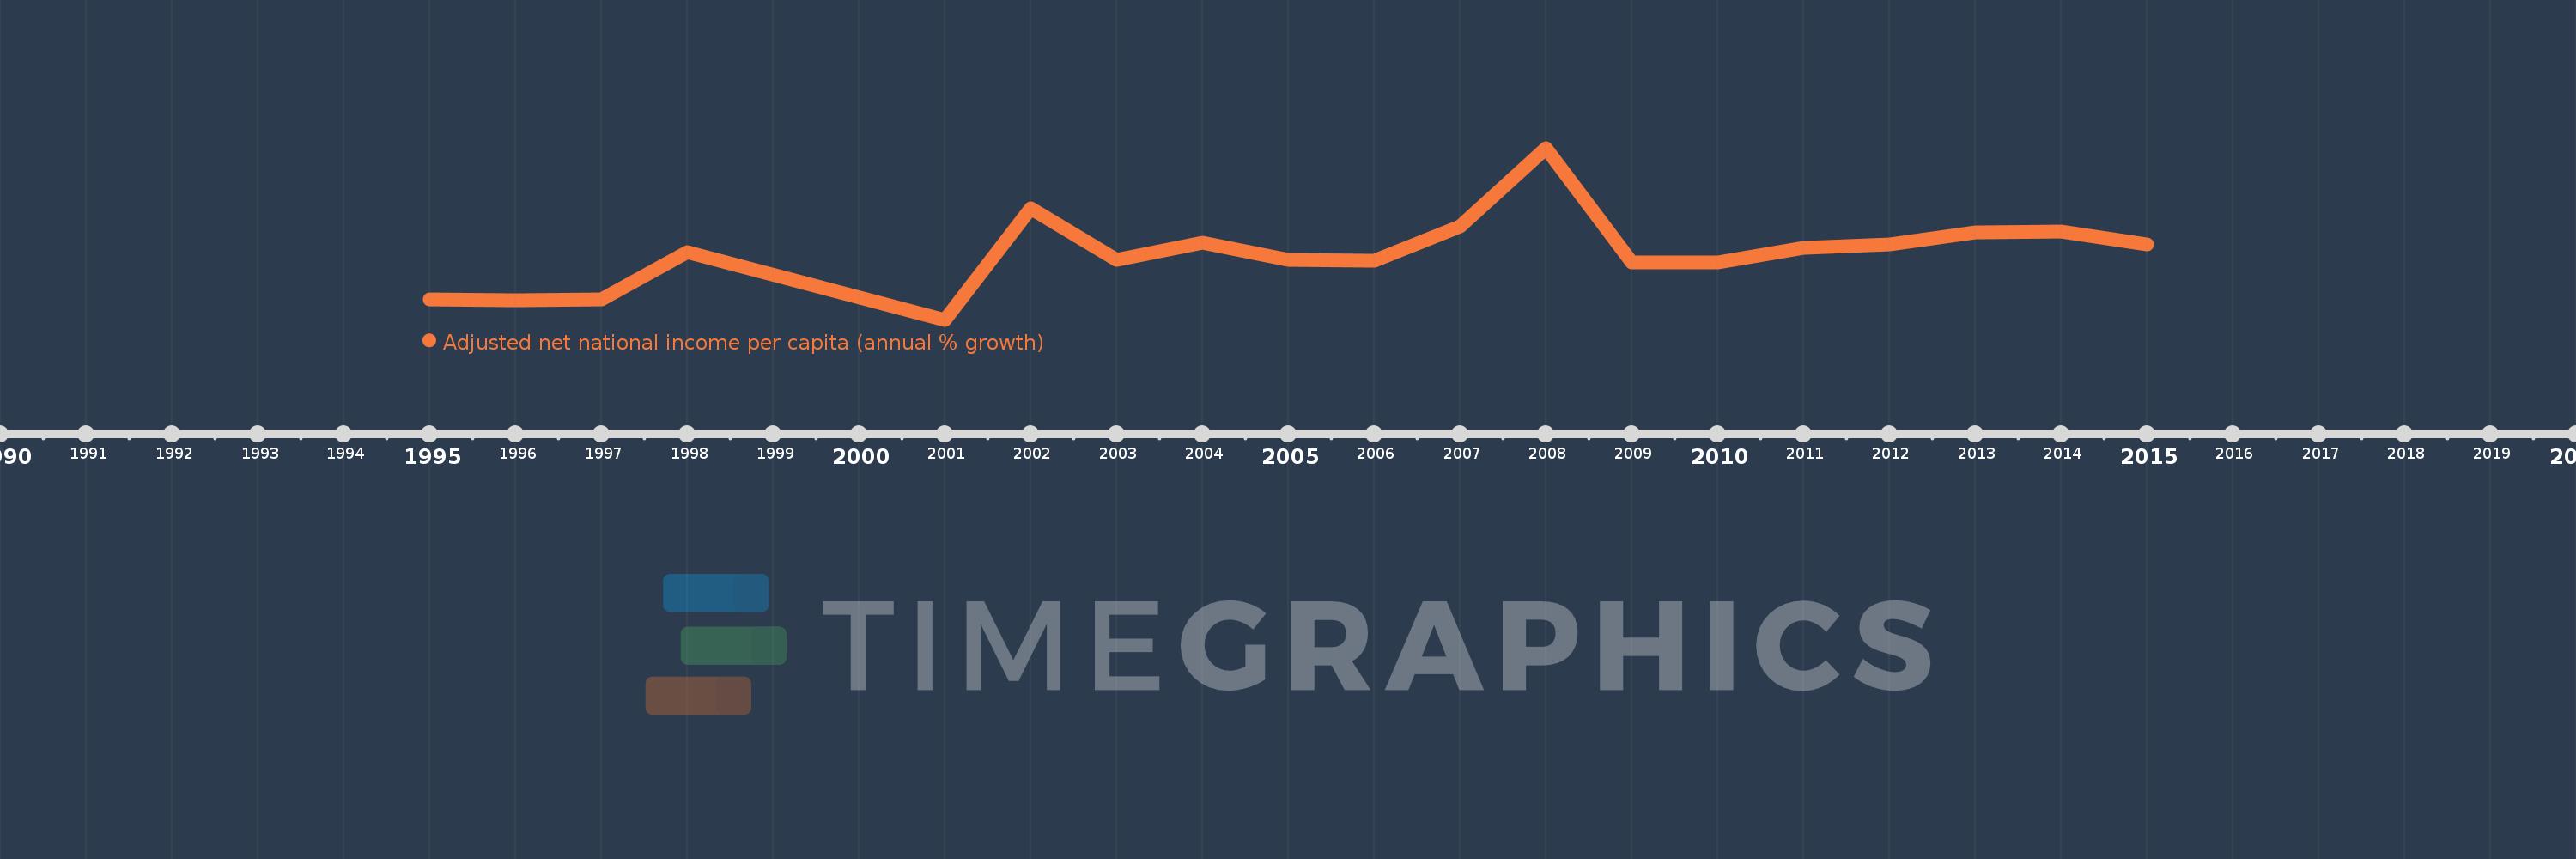
This timeline shows a graph from 1995 to 2015 of Kazakhstan. No data until 1994. Number of actual observations by date: 19.
Source name:
World Development Indicators
Source organization:
World Bank staff estimates based on sources and methods in World Bank's "The Changing Wealth of Nations: Measuring Sustainable Development in the New Millennium" (2011).
Categories, topics:
Economy & Growth
Last updated:
apr 23, 2017
Indicators value changes by year
Meaning:
5.003
Minimum:
-17.295
jan 1, 2001
Maximum:
39.927
jan 1, 2008
At the date of observation
Value
Absolute change
Change from the previous value
jan 1, 1995
-10.609
-10.609
0.0%
jan 1, 1996
-10.921
-0.312
2.94%
jan 1, 1997
-10.446
+0.476
-4.36%
jan 1, 1998
5.314
+15.759
-150.87%
jan 1, 2001
-17.295
-22.609
-425.48%
jan 1, 2002
19.675
+36.97
-213.76%
jan 1, 2003
2.677
-16.998
-86.4%
jan 1, 2004
8.498
+5.822
217.5%
jan 1, 2005
2.531
-5.967
-70.21%
jan 1, 2006
2.375
-0.156
-6.17%
jan 1, 2007
13.686
+11.311
476.22%
jan 1, 2008
39.927
+26.241
191.74%
jan 1, 2009
1.772
-38.155
-95.56%
jan 1, 2010
1.795
+0.023
1.29%
jan 1, 2011
6.571
+4.775
266.0%
jan 1, 2012
7.83
+1.259
19.16%
jan 1, 2013
11.813
+3.983
50.87%
jan 1, 2014
12.043
+0.229
1.94%
jan 1, 2015
7.82
-4.223
-35.07%
Ranking of countries by current statistics by years
