29
/
en
AIzaSyAYiBZKx7MnpbEhh9jyipgxe19OcubqV5w
April 1, 2024
197089
Moldova
MDA
true
2
1
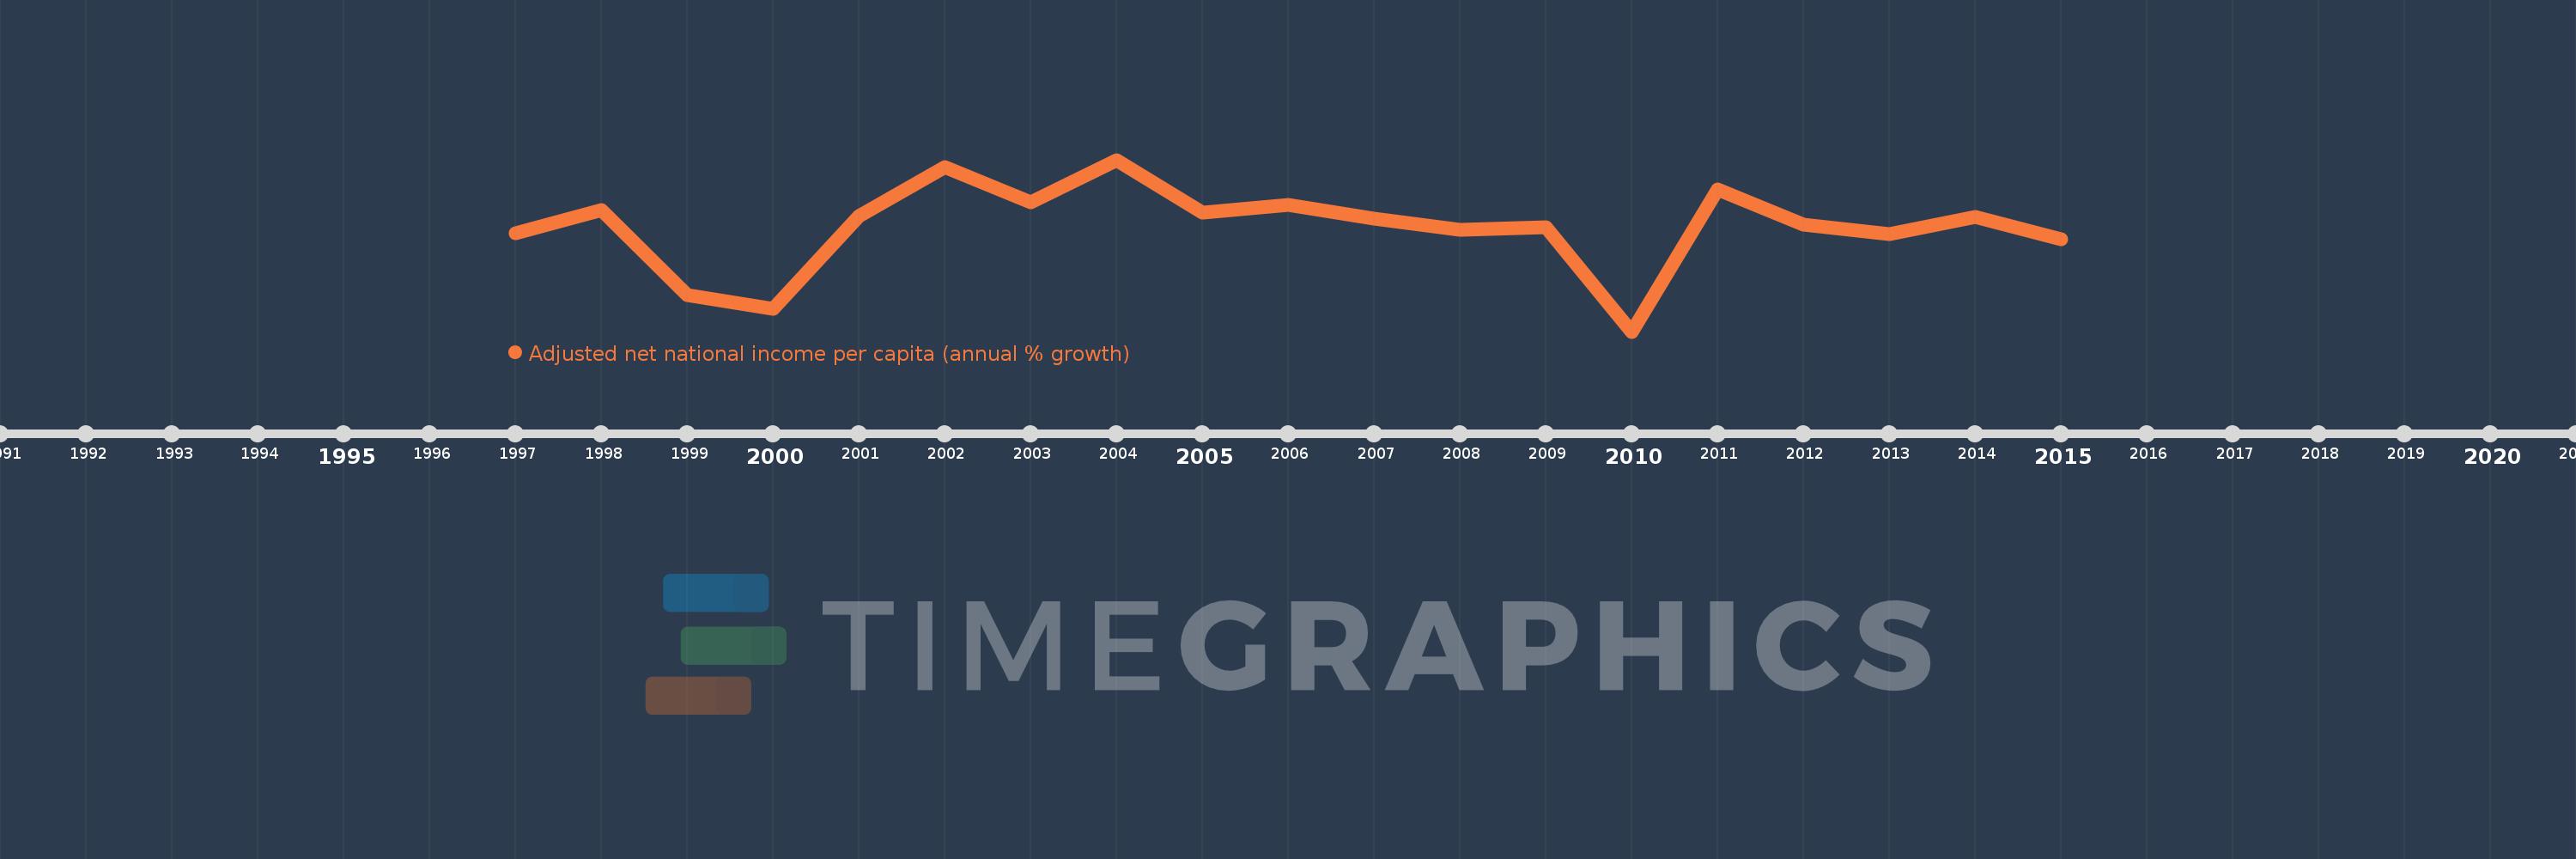
Adjusted net national income per capita (annual % growth)
2015,2014,2013,2012,2011,2010,2009,2008,2007,2006,2005,2004,2003,2002,2001,2000,1999,1998,1997
This statistics in other country:
Timeline:
This timeline shows a graph from 1997 to 2015 of Moldova. No data until 1996. Number of actual observations by date: 19.
Source name:
World Development Indicators
Source organization:
World Bank staff estimates based on sources and methods in World Bank's "The Changing Wealth of Nations: Measuring Sustainable Development in the New Millennium" (2011).
Categories, topics:
Economy & Growth
Last updated:
apr 23, 2017
Indicators value changes by year
Minimum:
-12.582
jan 1, 2010
Maximum:
16.403
jan 1, 2004
At the date of observation
Value
Absolute change
Change from previous value
jan 1, 1997
4.011
+4.011
0.0%
jan 1, 1998
7.897
+3.886
96.88%
jan 1, 1999
-6.383
-14.28
-180.83%
jan 1, 2000
-8.793
-2.41
37.76%
jan 1, 2001
6.863
+15.656
-178.05%
jan 1, 2002
15.19
+8.327
121.34%
jan 1, 2003
9.282
-5.908
-38.89%
jan 1, 2004
16.403
+7.121
76.71%
jan 1, 2005
7.561
-8.842
-53.9%
jan 1, 2006
8.842
+1.281
16.95%
jan 1, 2007
6.533
-2.309
-26.12%
jan 1, 2008
4.62
-1.913
-29.29%
jan 1, 2009
5.012
+0.392
8.48%
jan 1, 2010
-12.582
-17.593
-351.06%
jan 1, 2011
11.396
+23.978
-190.58%
jan 1, 2012
5.472
-5.924
-51.98%
jan 1, 2013
3.906
-1.567
-28.63%
jan 1, 2014
6.779
+2.873
73.56%
jan 1, 2015
2.93
-3.849
-56.78%
Ranking of countries by current statistics by years


Comments: