29
/
en
AIzaSyAYiBZKx7MnpbEhh9jyipgxe19OcubqV5w
April 1, 2024
275372
United Kingdom
GBR
true
2
1
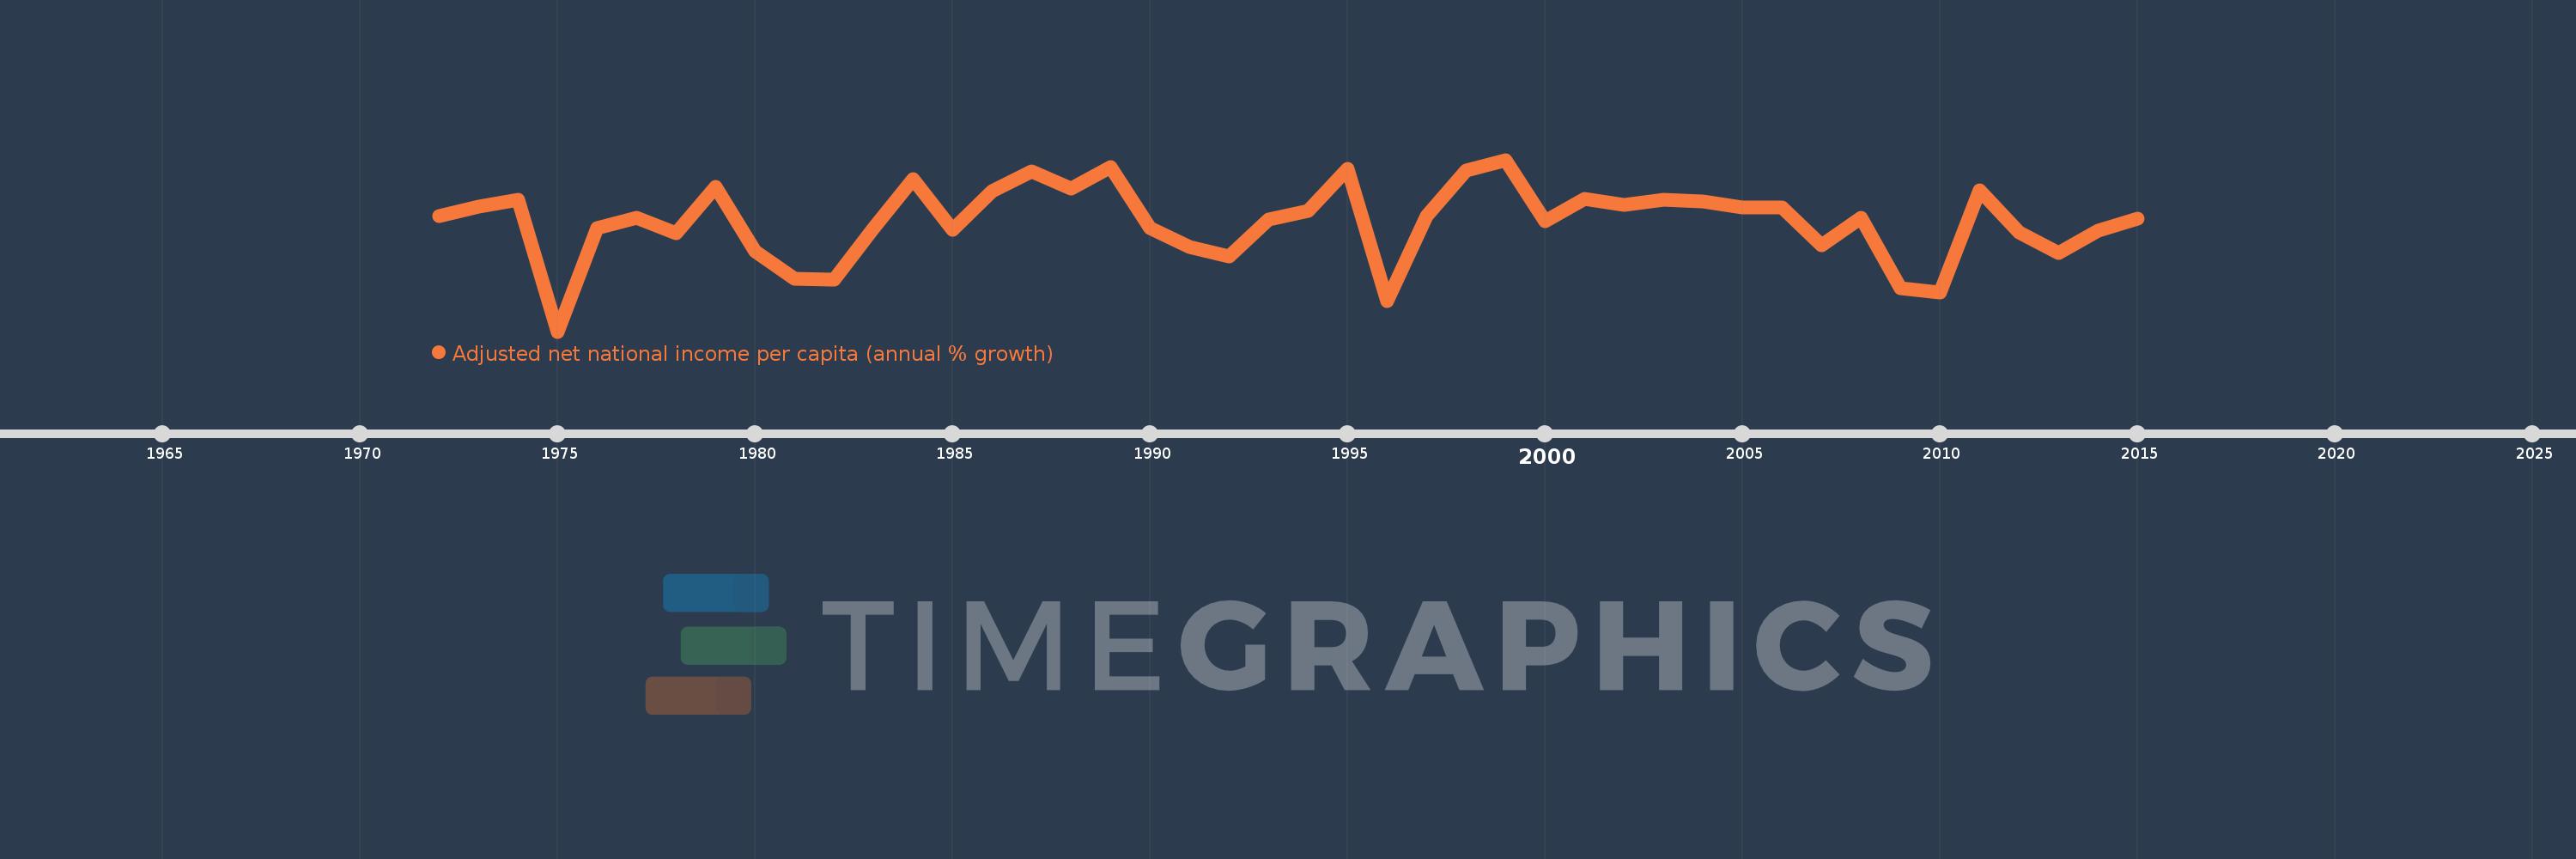
Adjusted net national income per capita (annual % growth)
2015,2014,2013,2012,2011,2010,2009,2008,2007,2006,2005,2004,2003,2002,2001,2000,1999,1998,1997,1996,1995,1994,1993,1992,1991,1990,1989,1988,1987,1986,1985,1984,1983,1982,1981,1980,1979,1978,1977,1976,1975,1974,1973,1972
This statistics in other country:
Timeline:
This timeline shows a graph from 1972 to 2015 of United Kingdom. No data until 1971. Number of actual observations by date: 44.
Source name:
World Development Indicators
Source organization:
World Bank staff estimates based on sources and methods in World Bank's "The Changing Wealth of Nations: Measuring Sustainable Development in the New Millennium" (2011).
Categories, topics:
Economy & Growth
Last updated:
apr 23, 2017
Indicators value changes by year
Minimum:
-6.364
jan 1, 1975
At the date of observation
Value
Absolute change
Change from previous value
jan 1, 1972
2.29
+2.29
0.0%
jan 1, 1973
2.954
+0.664
29.01%
jan 1, 1974
3.463
+0.508
17.2%
jan 1, 1975
-6.364
-9.827
-283.8%
jan 1, 1976
1.35
+7.714
-121.21%
jan 1, 1977
2.14
+0.79
58.57%
jan 1, 1978
0.968
-1.172
-54.76%
jan 1, 1979
4.435
+3.466
358.0%
jan 1, 1980
-0.37
-4.804
-108.34%
jan 1, 1981
-2.391
-2.021
546.44%
jan 1, 1982
-2.5
-0.109
4.57%
jan 1, 1983
1.337
+3.837
-153.47%
jan 1, 1984
5.008
+3.671
274.65%
jan 1, 1985
1.224
-3.784
-75.56%
jan 1, 1986
4.101
+2.877
235.09%
jan 1, 1987
5.566
+1.465
35.71%
jan 1, 1988
4.304
-1.261
-22.66%
jan 1, 1989
5.936
+1.631
37.9%
jan 1, 1990
1.332
-4.604
-77.56%
jan 1, 1991
-0.033
-1.366
-102.5%
jan 1, 1992
-0.763
-0.729
2.19K%
jan 1, 1993
2.007
+2.77
-363.11%
jan 1, 1994
2.625
+0.618
30.8%
jan 1, 1995
5.757
+3.132
119.3%
jan 1, 1996
-4.064
-9.821
-170.58%
jan 1, 1997
2.291
+6.355
-156.38%
jan 1, 1998
5.676
+3.385
147.75%
jan 1, 1999
6.462
+0.786
13.85%
jan 1, 2000
1.908
-4.554
-70.47%
jan 1, 2001
3.535
+1.626
85.22%
jan 1, 2002
3.122
-0.413
-11.67%
jan 1, 2003
3.484
+0.362
11.58%
jan 1, 2004
3.347
-0.137
-3.94%
jan 1, 2005
2.88
-0.466
-13.93%
jan 1, 2006
2.898
+0.018
0.62%
jan 1, 2007
0.093
-2.805
-96.79%
jan 1, 2008
2.157
+2.064
2.22K%
jan 1, 2009
-3.1
-5.257
-243.7%
jan 1, 2010
-3.43
-0.33
10.65%
jan 1, 2011
4.212
+7.641
-222.8%
jan 1, 2012
1.059
-3.153
-74.86%
jan 1, 2013
-0.487
-1.546
-146.01%
jan 1, 2014
1.198
+1.686
-345.95%
jan 1, 2015
2.089
+0.891
74.37%
Ranking of countries by current statistics by years


Comments: