29
/
en
AIzaSyAYiBZKx7MnpbEhh9jyipgxe19OcubqV5w
April 1, 2024
174981
Latvia
LVA
true
2
1
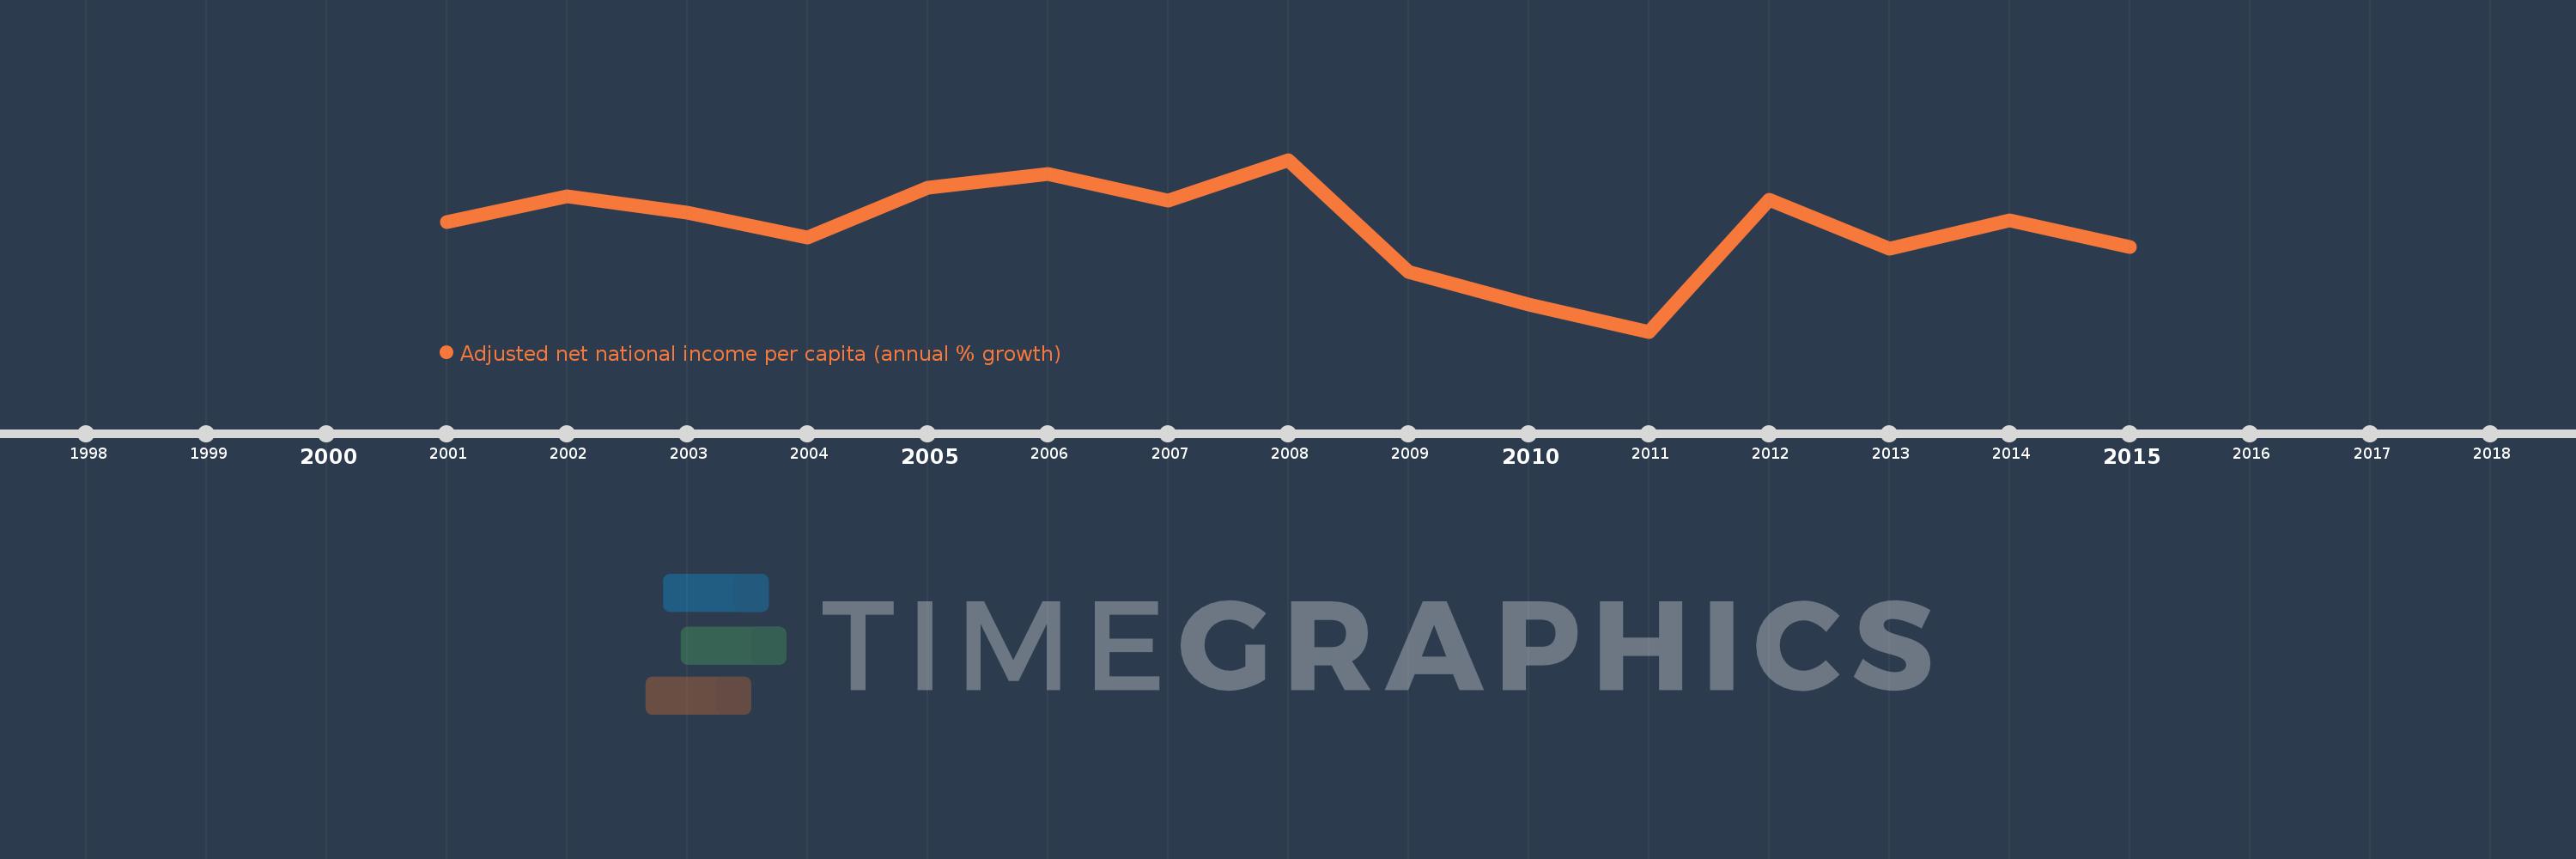
Adjusted net national income per capita (annual % growth)
2015,2014,2013,2012,2011,2010,2009,2008,2007,2006,2005,2004,2003,2002,2001
This statistics in other country:
Timeline:
This timeline shows a graph from 2001 to 2015 of Latvia. No data until 2000. Number of actual observations by date: 15.
Source name:
World Development Indicators
Source organization:
World Bank staff estimates based on sources and methods in World Bank's "The Changing Wealth of Nations: Measuring Sustainable Development in the New Millennium" (2011).
Categories, topics:
Economy & Growth
Last updated:
apr 23, 2017
Indicators value changes by year
Minimum:
-10.43
jan 1, 2011
Maximum:
15.382
jan 1, 2008
At the date of observation
Value
Absolute change
Change from previous value
jan 1, 2001
6.064
+6.064
0.0%
jan 1, 2002
9.943
+3.879
63.97%
jan 1, 2003
7.403
-2.54
-25.55%
jan 1, 2004
3.673
-3.73
-50.38%
jan 1, 2005
11.223
+7.55
205.53%
jan 1, 2006
13.242
+2.019
17.99%
jan 1, 2007
9.289
-3.953
-29.85%
jan 1, 2008
15.382
+6.093
65.6%
jan 1, 2009
-1.421
-16.803
-109.24%
jan 1, 2010
-6.304
-4.883
343.6%
jan 1, 2011
-10.43
-4.126
65.45%
jan 1, 2012
9.394
+19.824
-190.07%
jan 1, 2013
2.073
-7.321
-77.93%
jan 1, 2014
6.335
+4.262
205.55%
jan 1, 2015
2.258
-4.078
-64.36%
Ranking of countries by current statistics by years


Comments: