29
/
en
AIzaSyAYiBZKx7MnpbEhh9jyipgxe19OcubqV5w
April 1, 2024
162140
Jamaica
JAM
true
2
1
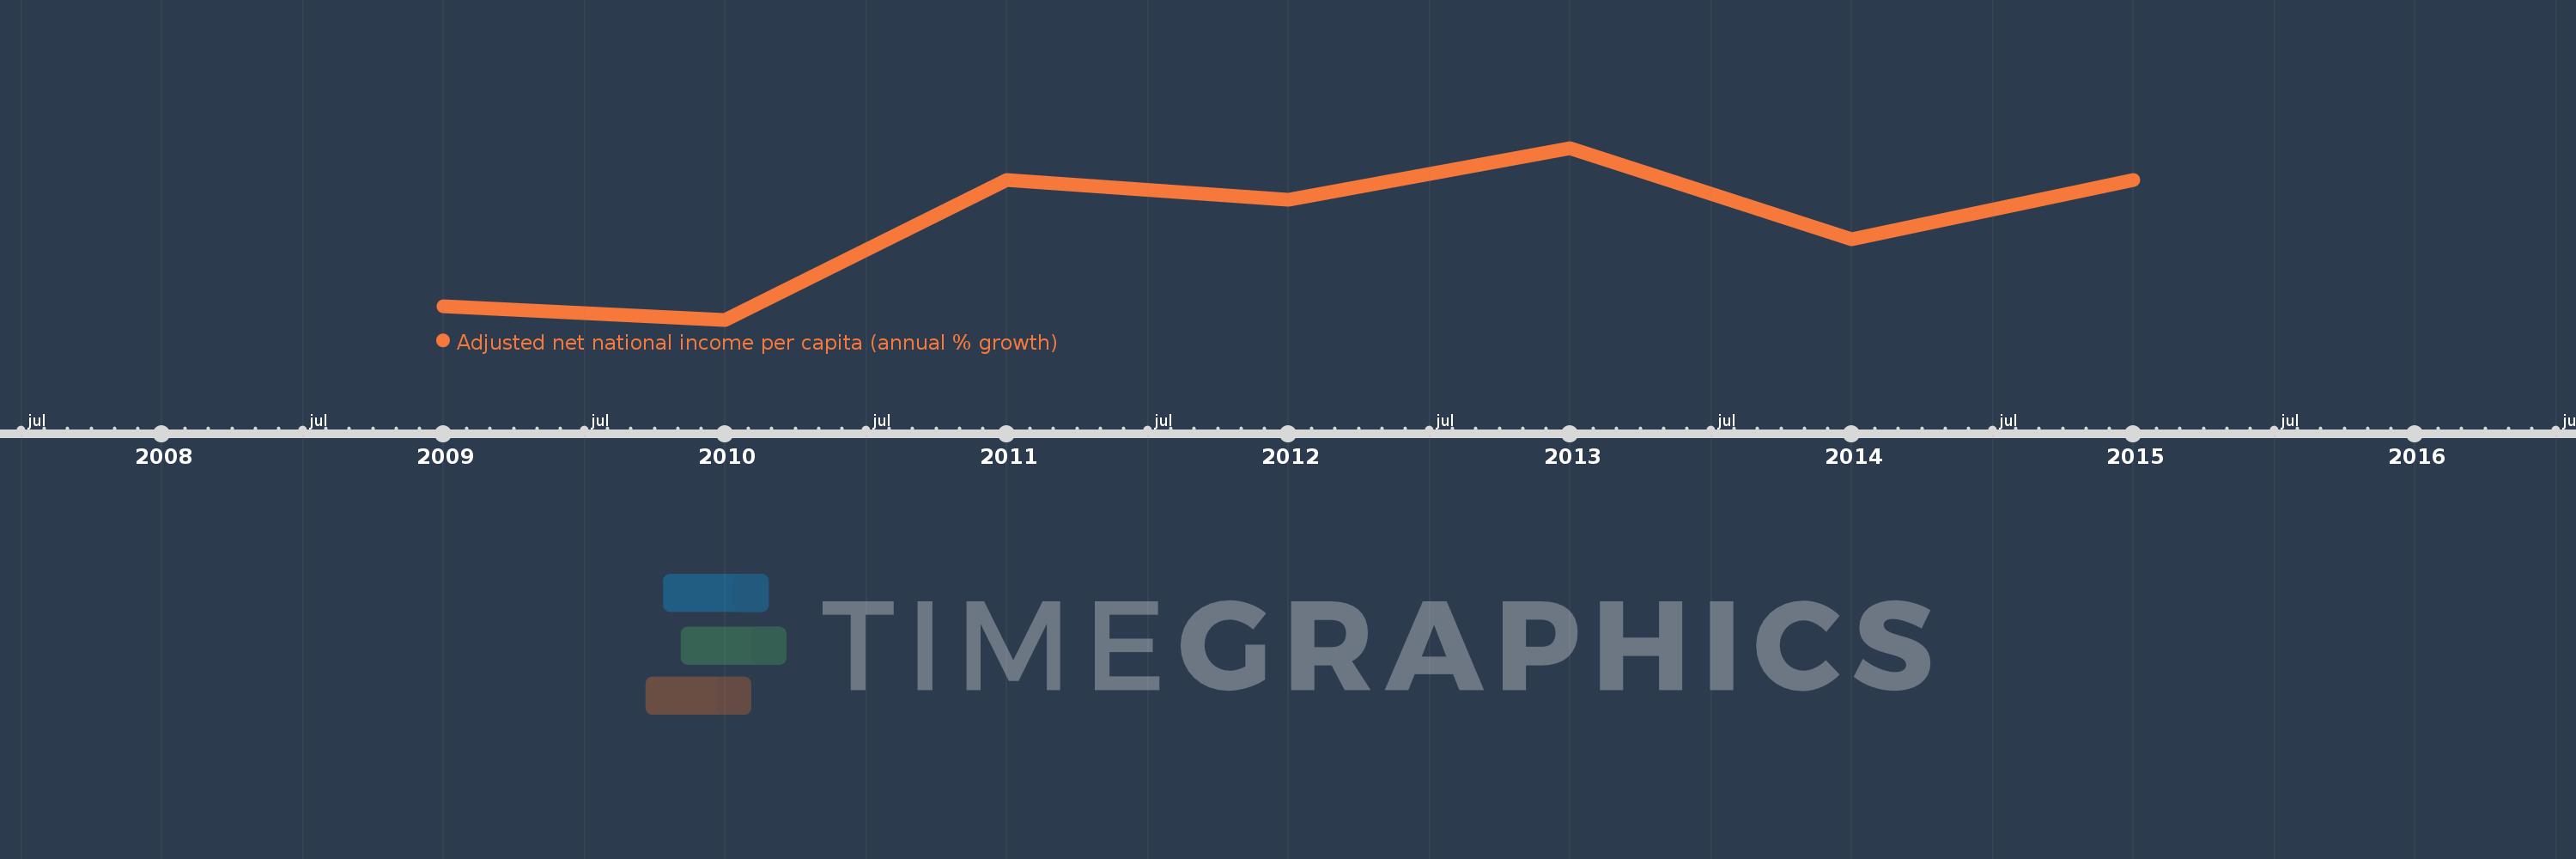
Adjusted net national income per capita (annual % growth)
2015,2014,2013,2012,2011,2010,2009
This statistics in other country:
Timeline:
This timeline shows a graph from 2009 to 2015 of Jamaica. No data until 2008. Number of actual observations by date: 7.
Source name:
World Development Indicators
Source organization:
World Bank staff estimates based on sources and methods in World Bank's "The Changing Wealth of Nations: Measuring Sustainable Development in the New Millennium" (2011).
Categories, topics:
Economy & Growth
Last updated:
apr 23, 2017
Indicators value changes by year
Minimum:
-5.077
jan 1, 2010
At the date of observation
Value
Absolute change
Change from previous value
jan 1, 2009
-4.548
-4.548
0.0%
jan 1, 2010
-5.077
-0.528
11.61%
jan 1, 2011
0.298
+5.374
-105.86%
jan 1, 2012
-0.451
-0.749
-251.45%
jan 1, 2013
1.536
+1.987
-440.58%
jan 1, 2014
-1.994
-3.53
-229.84%
jan 1, 2015
0.301
+2.295
-115.1%
Ranking of countries by current statistics by years


Comments: