29
/
en
AIzaSyAYiBZKx7MnpbEhh9jyipgxe19OcubqV5w
April 1, 2024
195116
Mexico
MEX
true
2
1
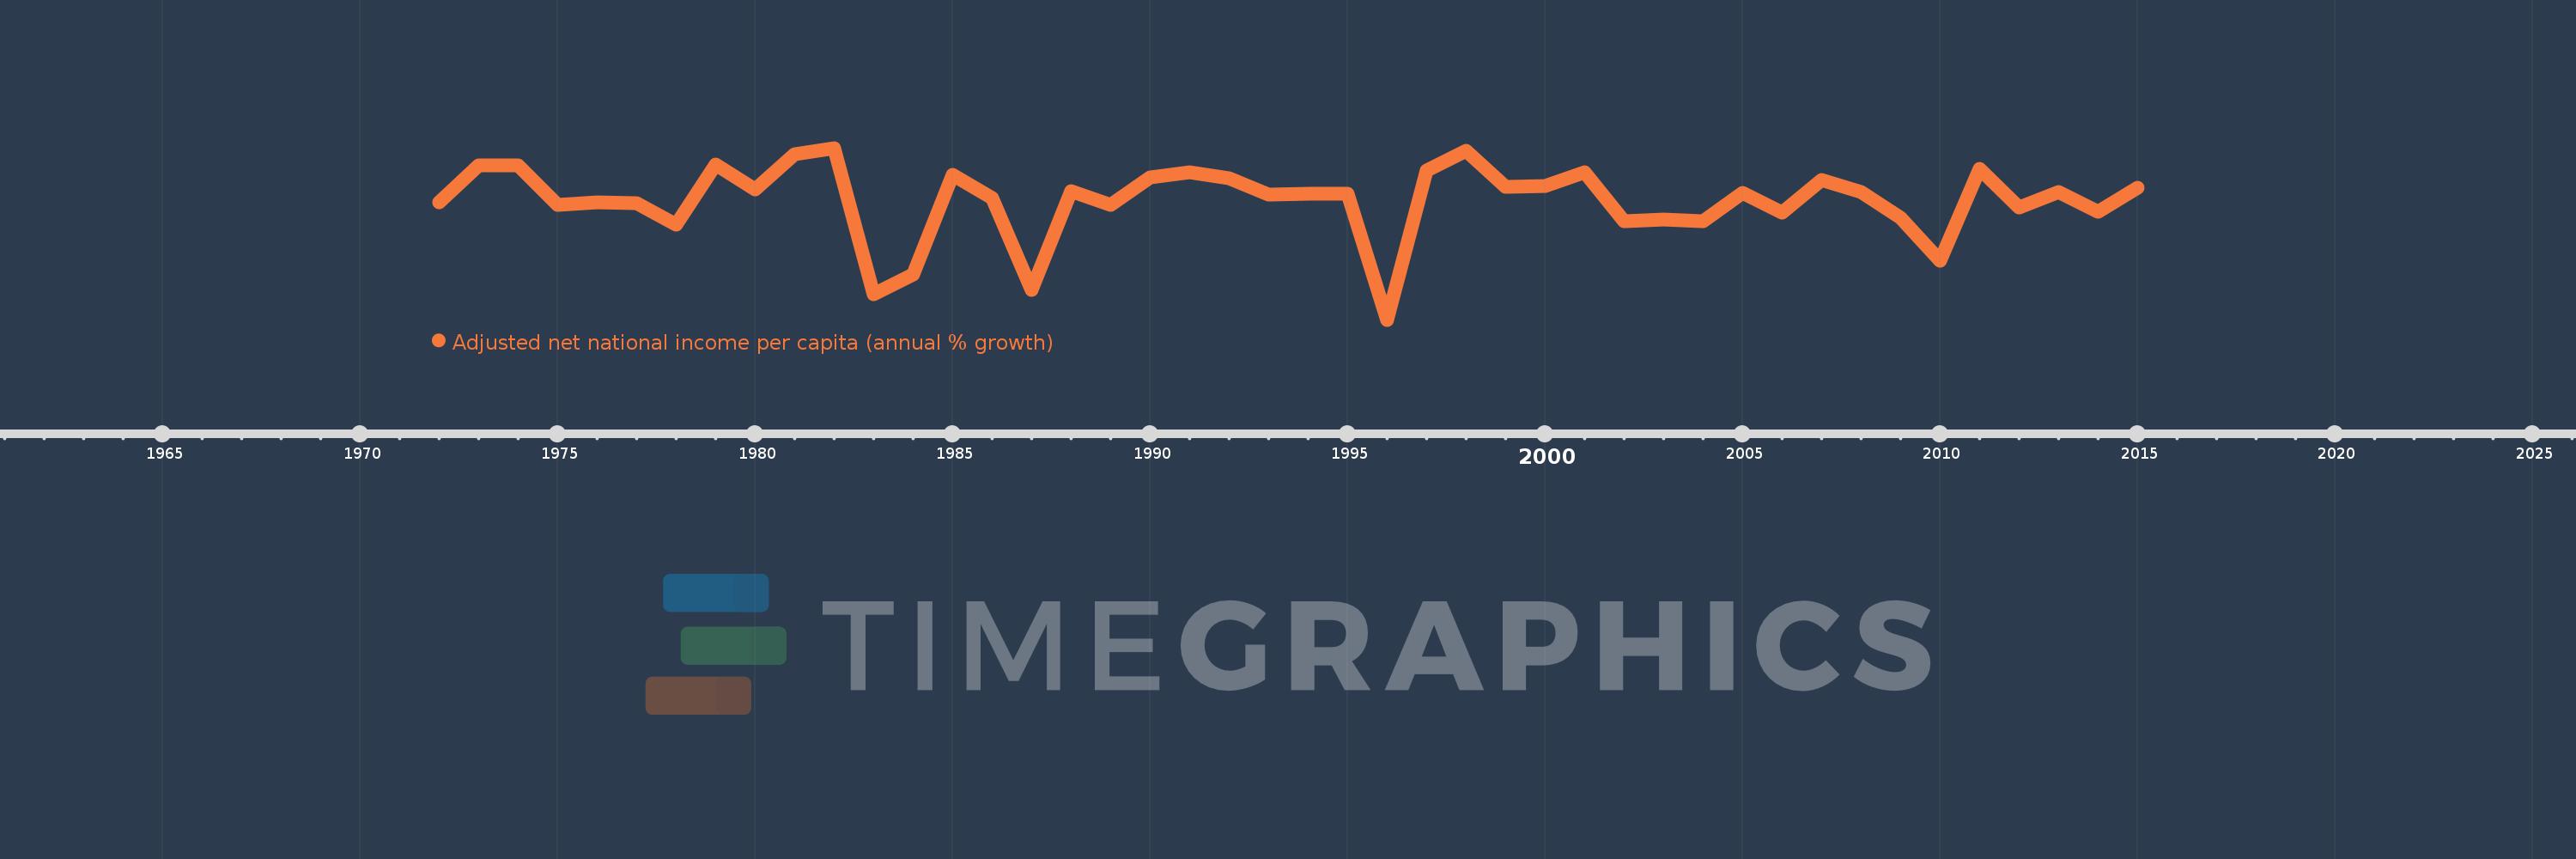
Adjusted net national income per capita (annual % growth)
2015,2014,2013,2012,2011,2010,2009,2008,2007,2006,2005,2004,2003,2002,2001,2000,1999,1998,1997,1996,1995,1994,1993,1992,1991,1990,1989,1988,1987,1986,1985,1984,1983,1982,1981,1980,1979,1978,1977,1976,1975,1974,1973,1972
This statistics in other country:
Timeline:
This timeline shows a graph from 1972 to 2015 of Mexico. No data until 1971. Number of actual observations by date: 44.
Source name:
World Development Indicators
Source organization:
World Bank staff estimates based on sources and methods in World Bank's "The Changing Wealth of Nations: Measuring Sustainable Development in the New Millennium" (2011).
Categories, topics:
Economy & Growth
Last updated:
apr 23, 2017
Indicators value changes by year
Minimum:
-12.496
jan 1, 1996
At the date of observation
Value
Absolute change
Change from previous value
jan 1, 1972
0.978
+0.978
0.0%
jan 1, 1973
5.249
+4.271
436.7%
jan 1, 1974
5.236
-0.013
-0.26%
jan 1, 1975
0.65
-4.586
-87.59%
jan 1, 1976
0.926
+0.277
42.59%
jan 1, 1977
0.843
-0.083
-8.97%
jan 1, 1978
-1.616
-2.459
-291.61%
jan 1, 1979
5.316
+6.931
-428.99%
jan 1, 1980
2.419
-2.897
-54.5%
jan 1, 1981
6.501
+4.083
168.79%
jan 1, 1982
7.2
+0.699
10.75%
jan 1, 1983
-9.575
-16.775
-232.98%
jan 1, 1984
-7.31
+2.265
-23.66%
jan 1, 1985
4.091
+11.401
-155.96%
jan 1, 1986
1.507
-2.583
-63.15%
jan 1, 1987
-9.066
-10.573
-701.4%
jan 1, 1988
2.254
+11.319
-124.86%
jan 1, 1989
0.674
-1.58
-70.1%
jan 1, 1990
3.788
+3.114
462.17%
jan 1, 1991
4.426
+0.639
16.86%
jan 1, 1992
3.748
-0.678
-15.33%
jan 1, 1993
1.81
-1.938
-51.71%
jan 1, 1994
1.93
+0.12
6.63%
jan 1, 1995
1.923
-0.007
-0.35%
jan 1, 1996
-12.496
-14.419
-749.71%
jan 1, 1997
4.651
+17.147
-137.22%
jan 1, 1998
6.883
+2.231
47.97%
jan 1, 1999
2.761
-4.121
-59.88%
jan 1, 2000
2.829
+0.068
2.47%
jan 1, 2001
4.384
+1.554
54.94%
jan 1, 2002
-1.175
-5.559
-126.81%
jan 1, 2003
-1.031
+0.145
-12.3%
jan 1, 2004
-1.194
-0.164
15.86%
jan 1, 2005
2.082
+3.276
-274.33%
jan 1, 2006
-0.209
-2.291
-110.04%
jan 1, 2007
3.515
+3.724
-1.78K%
jan 1, 2008
2.141
-1.374
-39.09%
jan 1, 2009
-0.832
-2.973
-138.83%
jan 1, 2010
-5.735
-4.904
589.73%
jan 1, 2011
4.817
+10.553
-184.0%
jan 1, 2012
0.392
-4.425
-91.86%
jan 1, 2013
2.138
+1.746
445.4%
jan 1, 2014
-0.16
-2.299
-107.49%
jan 1, 2015
2.667
+2.827
-1.77K%
Ranking of countries by current statistics by years


Comments: