29
/
en
AIzaSyAYiBZKx7MnpbEhh9jyipgxe19OcubqV5w
April 1, 2024
285460
Zambia
ZMB
true
2
1
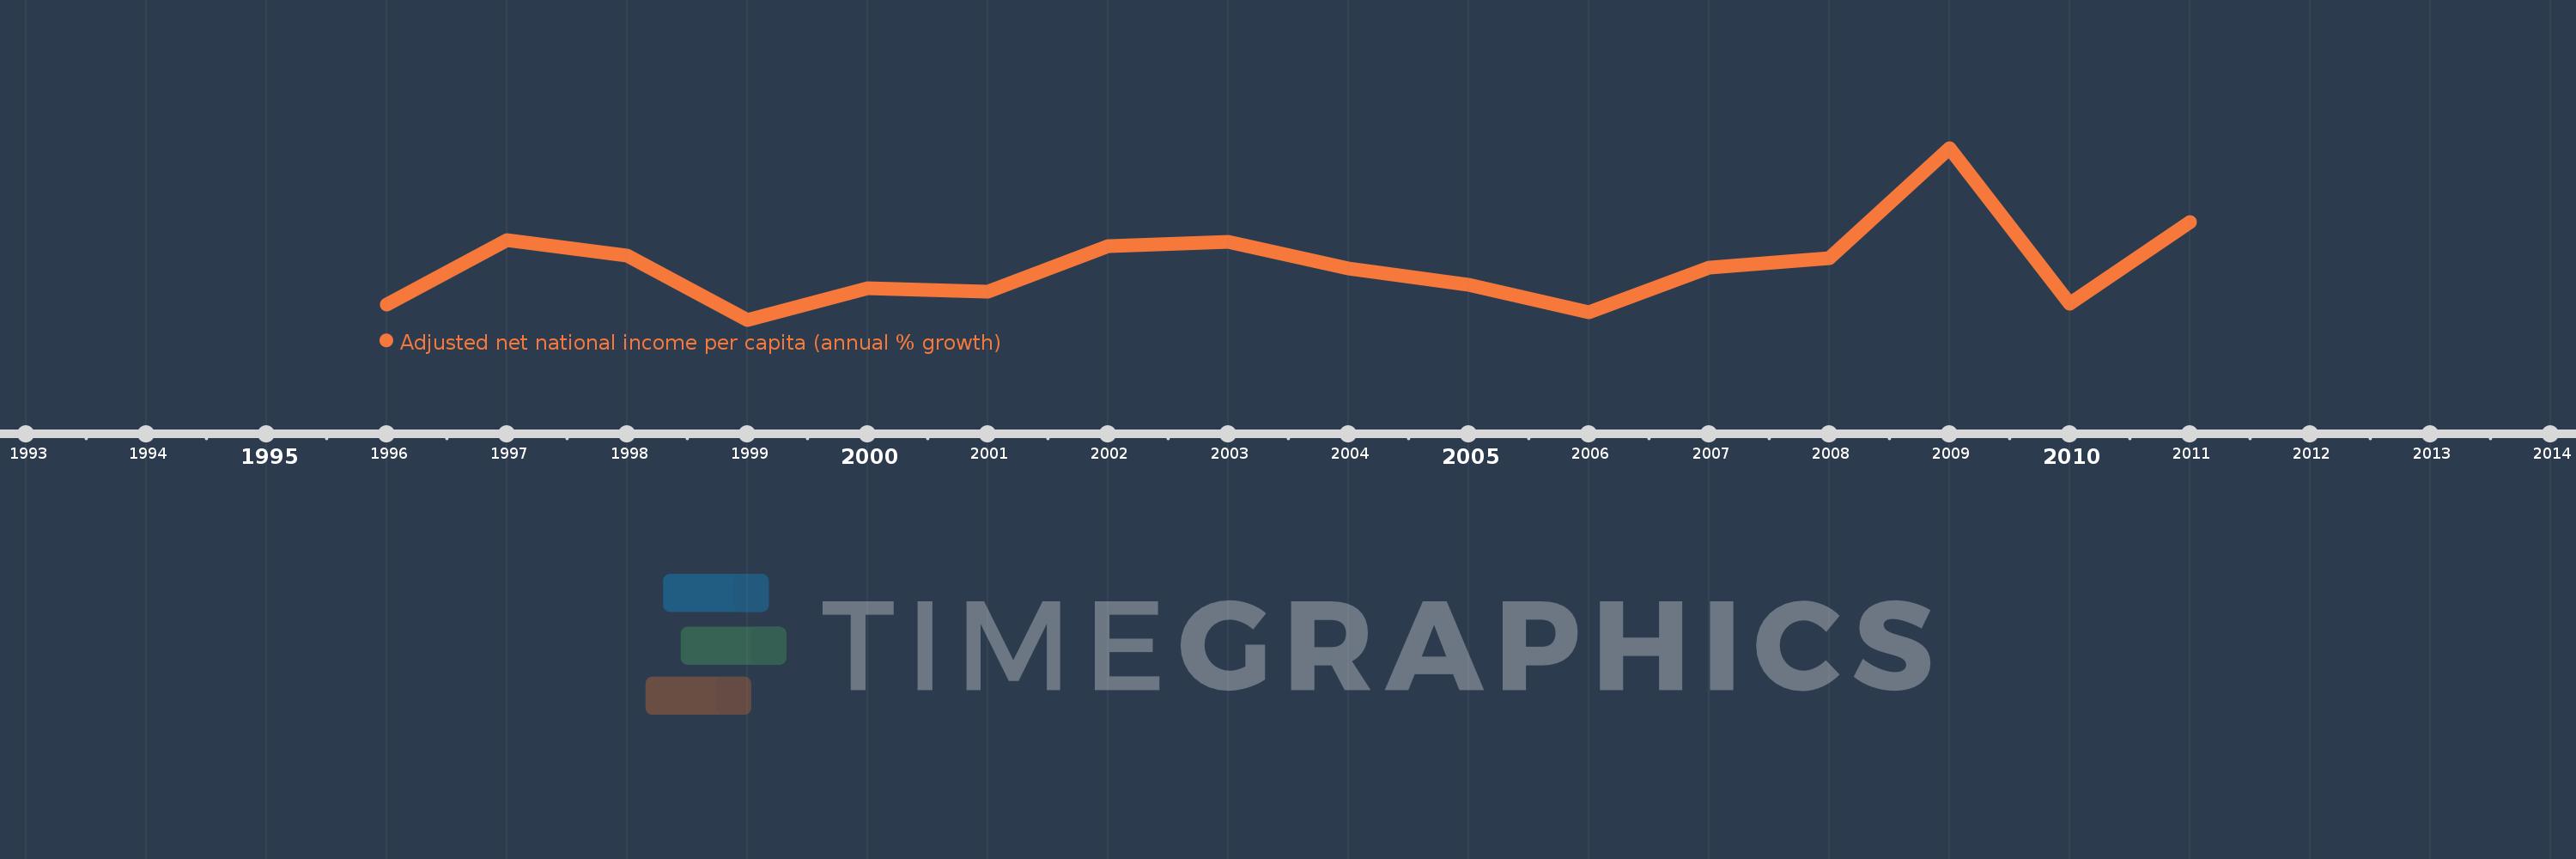
Adjusted net national income per capita (annual % growth)
2011,2010,2009,2008,2007,2006,2005,2004,2003,2002,2001,2000,1999,1998,1997,1996
This statistics in other country:
Timeline:
This timeline shows a graph from 1996 to 2011 of Zambia. No data until 1995. Number of actual observations by date: 16.
Source name:
World Development Indicators
Source organization:
World Bank staff estimates based on sources and methods in World Bank's "The Changing Wealth of Nations: Measuring Sustainable Development in the New Millennium" (2011).
Categories, topics:
Economy & Growth
Last updated:
apr 23, 2017
Indicators value changes by year
Minimum:
-4.395
jan 1, 1999
Maximum:
17.045
jan 1, 2009
At the date of observation
Value
Absolute change
Change from previous value
jan 1, 1996
-2.499
-2.499
0.0%
jan 1, 1997
5.504
+8.003
-320.28%
jan 1, 1998
3.636
-1.868
-33.93%
jan 1, 1999
-4.395
-8.031
-220.86%
jan 1, 2000
-0.41
+3.985
-90.67%
jan 1, 2001
-0.885
-0.475
115.8%
jan 1, 2002
4.833
+5.718
-646.04%
jan 1, 2003
5.343
+0.51
10.55%
jan 1, 2004
1.977
-3.366
-63.0%
jan 1, 2005
-0.007
-1.984
-100.36%
jan 1, 2006
-3.501
-3.494
49.3K%
jan 1, 2007
2.069
+5.571
-159.1%
jan 1, 2008
3.311
+1.242
60.02%
jan 1, 2009
17.045
+13.734
414.76%
jan 1, 2010
-2.441
-19.487
-114.32%
jan 1, 2011
7.789
+10.23
-419.05%
Ranking of countries by current statistics by years


Comments: