29
/
en
AIzaSyAYiBZKx7MnpbEhh9jyipgxe19OcubqV5w
April 1, 2024
39671
IDA total
IDA
false
2
1
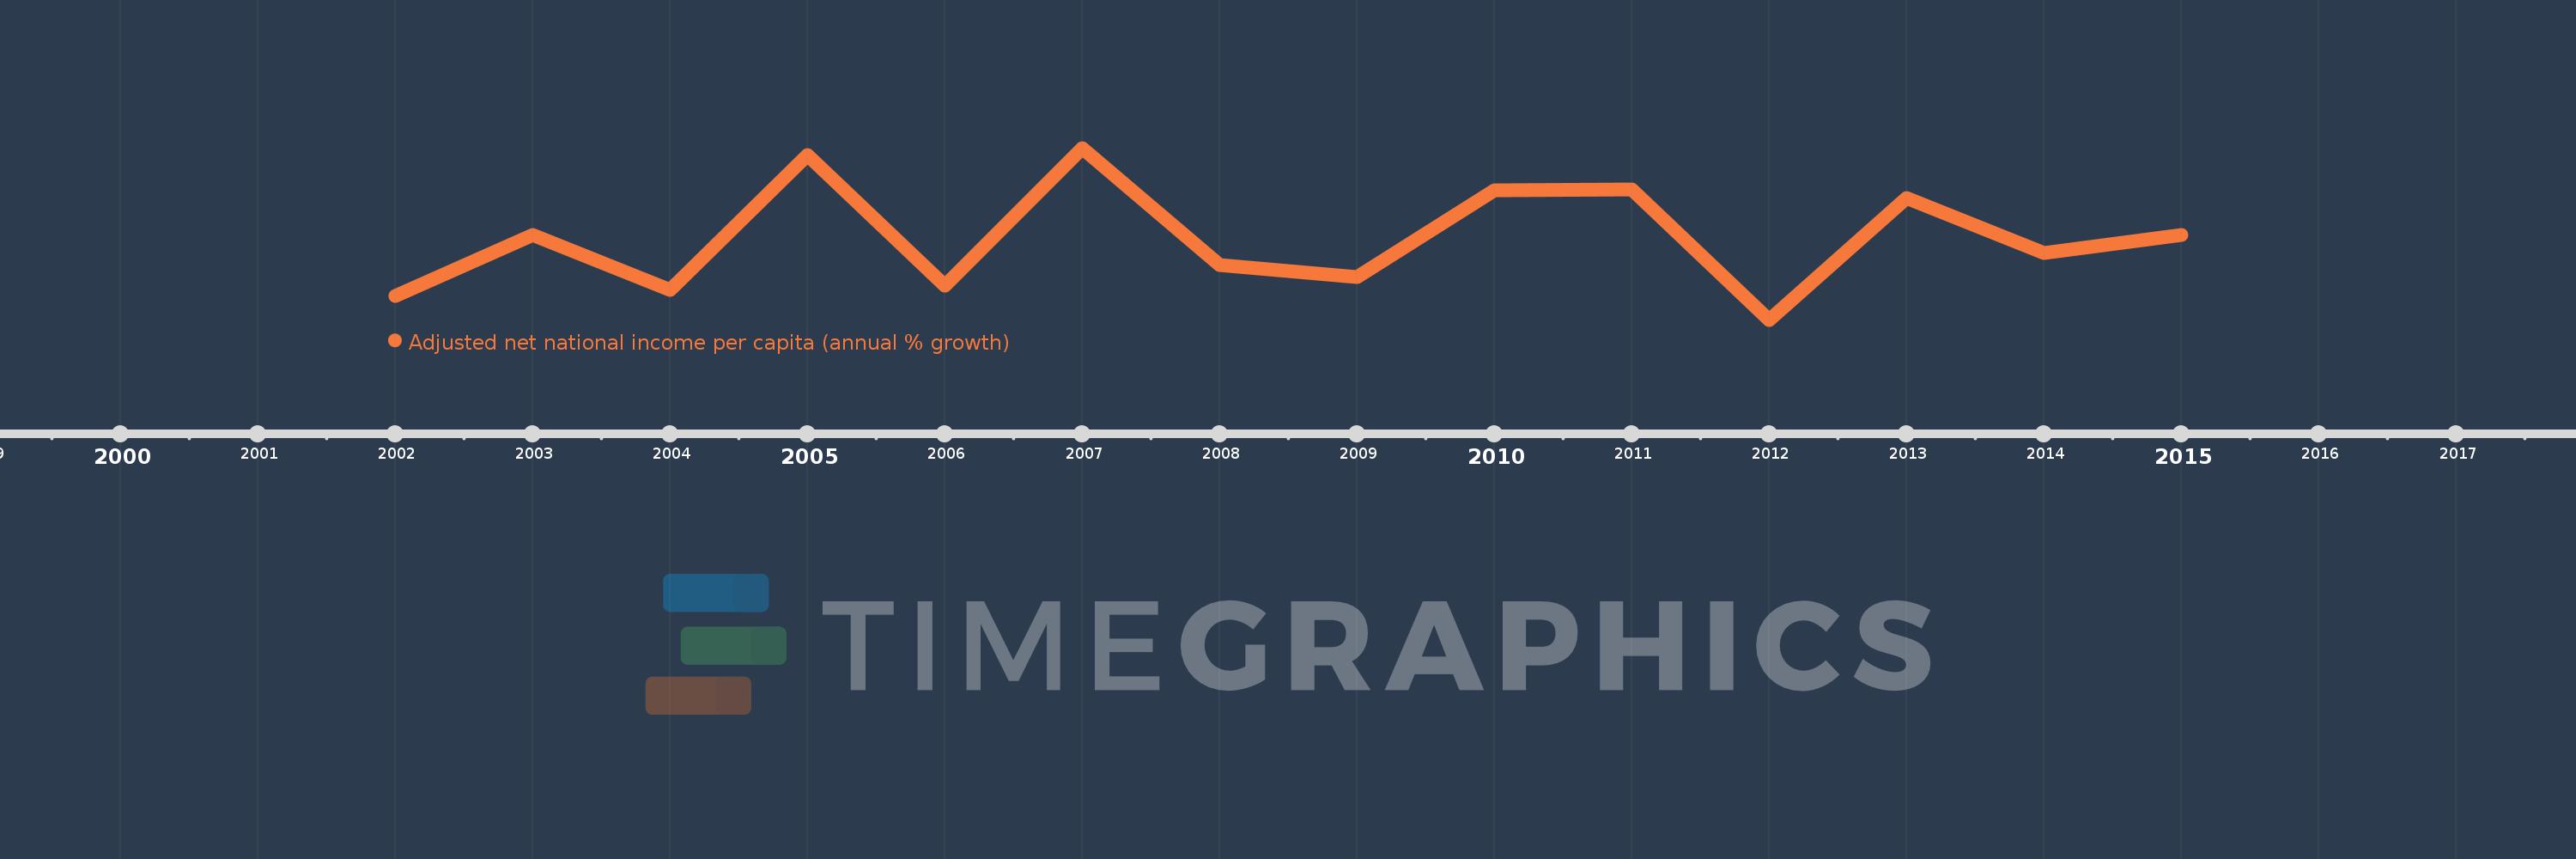
Adjusted net national income per capita (annual % growth)
2015,2014,2013,2012,2011,2010,2009,2008,2007,2006,2005,2004,2003,2002
This statistics in other country:
Timeline:
This timeline shows a graph from 2002 to 2015 of IDA total. No data until 2001. Number of actual observations by date: 14.
Source name:
World Development Indicators
Source organization:
World Bank staff estimates based on sources and methods in World Bank's "The Changing Wealth of Nations: Measuring Sustainable Development in the New Millennium" (2011).
Categories, topics:
Economy & Growth
Last updated:
apr 23, 2017
Indicators value changes by year
Minimum:
-0.749
jan 1, 2012
At the date of observation
Value
Absolute change
Change from previous value
jan 1, 2002
0.622
+0.622
0.0%
jan 1, 2003
4.131
+3.509
564.39%
jan 1, 2004
0.939
-3.192
-77.27%
jan 1, 2005
8.686
+7.747
825.17%
jan 1, 2006
1.193
-7.493
-86.27%
jan 1, 2007
9.096
+7.903
662.71%
jan 1, 2008
2.384
-6.712
-73.79%
jan 1, 2009
1.674
-0.711
-29.81%
jan 1, 2010
6.65
+4.976
297.33%
jan 1, 2011
6.733
+0.083
1.25%
jan 1, 2012
-0.749
-7.482
-111.12%
jan 1, 2013
6.231
+6.98
-932.31%
jan 1, 2014
3.09
-3.141
-50.41%
jan 1, 2015
4.093
+1.003
32.46%
Ranking of countries by current statistics by years


Comments: