29
/
en
AIzaSyAYiBZKx7MnpbEhh9jyipgxe19OcubqV5w
April 1, 2024
187402
Malaysia
MYS
true
2
1
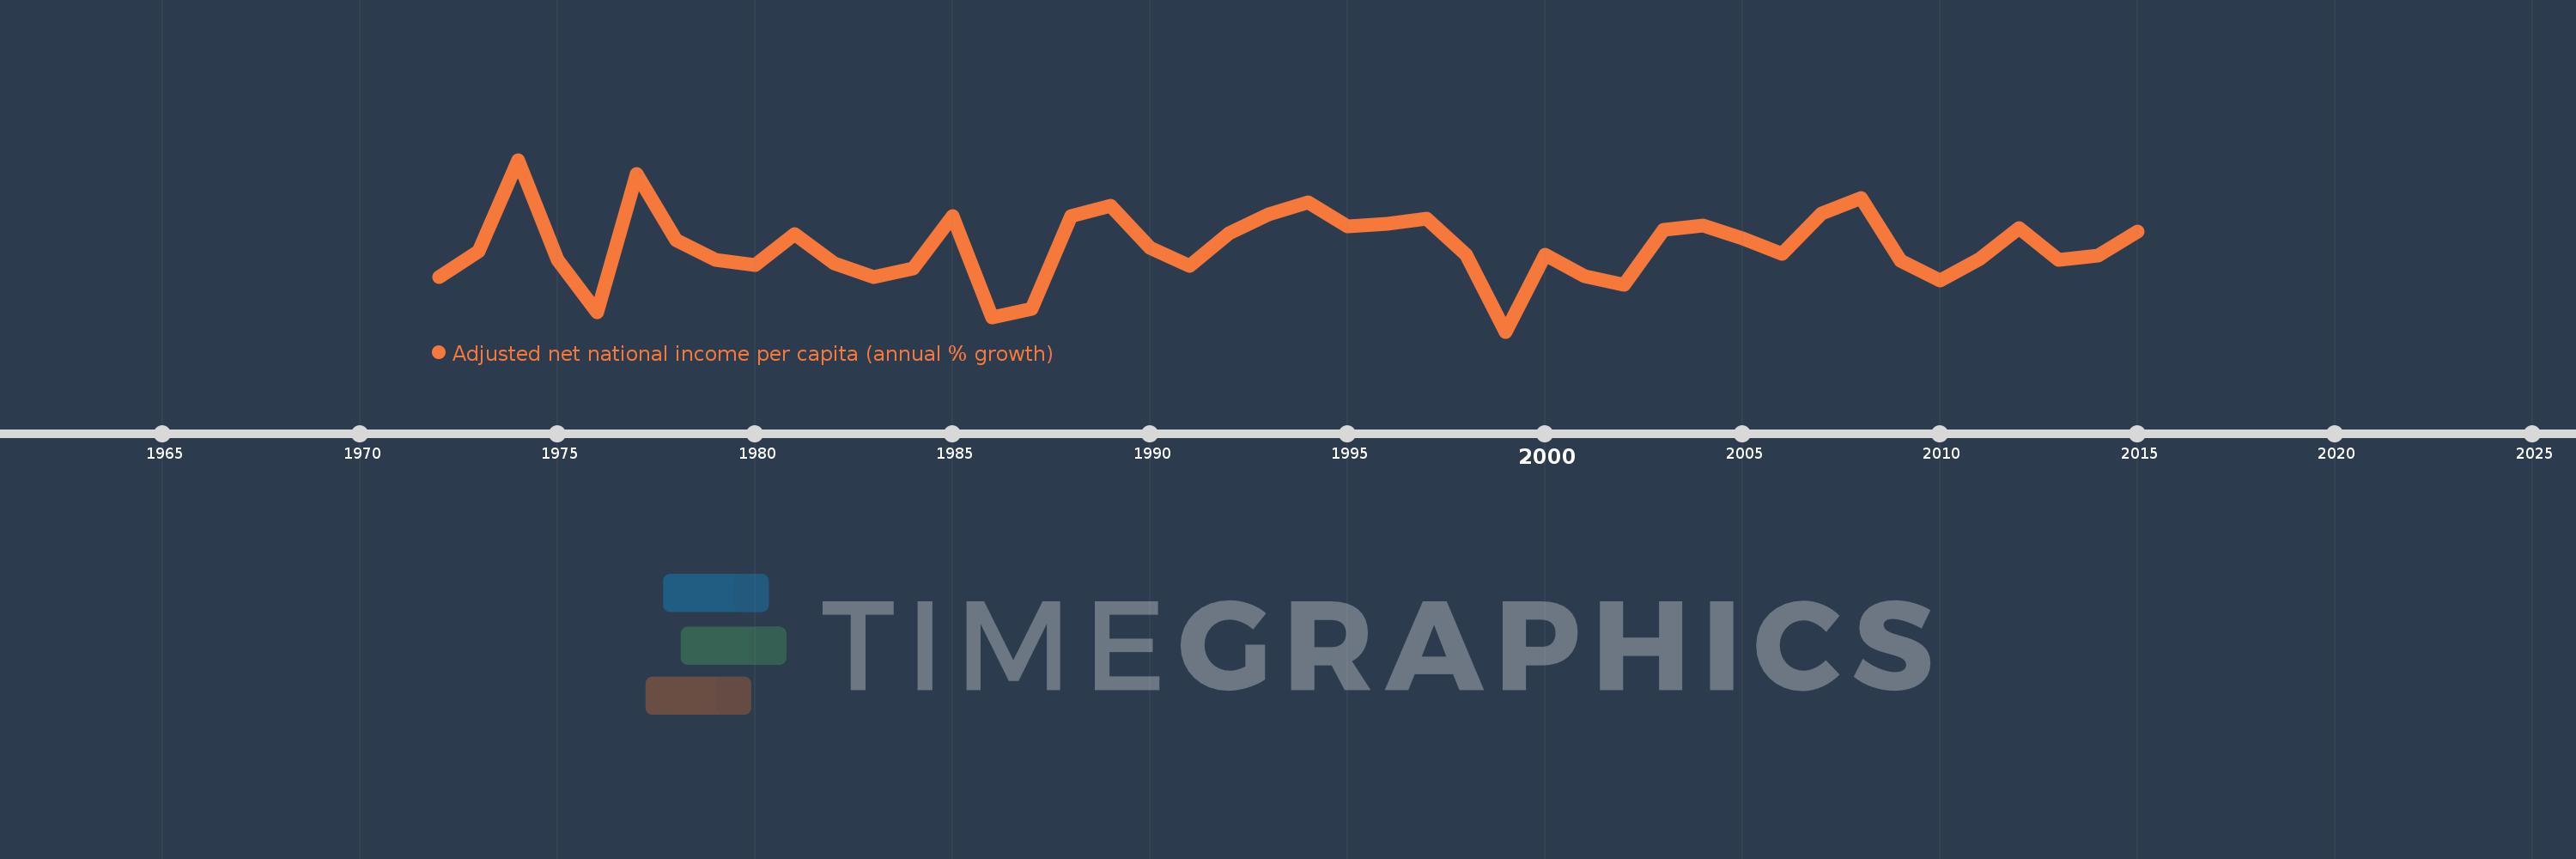
Adjusted net national income per capita (annual % growth)
2015,2014,2013,2012,2011,2010,2009,2008,2007,2006,2005,2004,2003,2002,2001,2000,1999,1998,1997,1996,1995,1994,1993,1992,1991,1990,1989,1988,1987,1986,1985,1984,1983,1982,1981,1980,1979,1978,1977,1976,1975,1974,1973,1972
This statistics in other country:
Timeline:
This timeline shows a graph from 1972 to 2015 of Malaysia. No data until 1971. Number of actual observations by date: 44.
Source name:
World Development Indicators
Source organization:
World Bank staff estimates based on sources and methods in World Bank's "The Changing Wealth of Nations: Measuring Sustainable Development in the New Millennium" (2011).
Categories, topics:
Economy & Growth
Last updated:
apr 23, 2017
Indicators value changes by year
Minimum:
-8.702
jan 1, 1999
Maximum:
16.402
jan 1, 1974
At the date of observation
Value
Absolute change
Change from previous value
jan 1, 1972
-0.738
-0.738
0.0%
jan 1, 1973
3.02
+3.757
-509.32%
jan 1, 1974
16.402
+13.382
443.17%
jan 1, 1975
1.744
-14.658
-89.37%
jan 1, 1976
-5.902
-7.646
-438.4%
jan 1, 1977
14.337
+20.238
-342.93%
jan 1, 1978
4.715
-9.622
-67.11%
jan 1, 1979
1.816
-2.899
-61.49%
jan 1, 1980
1.078
-0.738
-40.64%
jan 1, 1981
5.516
+4.438
411.77%
jan 1, 1982
1.315
-4.201
-76.16%
jan 1, 1983
-0.734
-2.048
-155.8%
jan 1, 1984
0.483
+1.217
-165.87%
jan 1, 1985
8.233
+7.75
1.6K%
jan 1, 1986
-6.589
-14.822
-180.03%
jan 1, 1987
-5.316
+1.273
-19.32%
jan 1, 1988
8.17
+13.486
-253.68%
jan 1, 1989
9.744
+1.574
19.26%
jan 1, 1990
3.578
-6.166
-63.28%
jan 1, 1991
0.915
-2.663
-74.43%
jan 1, 1992
5.719
+4.804
525.03%
jan 1, 1993
8.378
+2.66
46.51%
jan 1, 1994
10.145
+1.766
21.08%
jan 1, 1995
6.637
-3.508
-34.58%
jan 1, 1996
7.066
+0.429
6.47%
jan 1, 1997
7.791
+0.725
10.27%
jan 1, 1998
2.555
-5.236
-67.2%
jan 1, 1999
-8.702
-11.257
-440.54%
jan 1, 2000
2.492
+11.193
-128.64%
jan 1, 2001
-0.568
-3.06
-122.81%
jan 1, 2002
-1.886
-1.318
231.89%
jan 1, 2003
6.12
+8.006
-424.49%
jan 1, 2004
6.764
+0.644
10.53%
jan 1, 2005
4.882
-1.882
-27.83%
jan 1, 2006
2.63
-2.251
-46.12%
jan 1, 2007
8.544
+5.914
224.83%
jan 1, 2008
10.854
+2.31
27.03%
jan 1, 2009
1.619
-9.236
-85.09%
jan 1, 2010
-1.268
-2.886
-178.31%
jan 1, 2011
1.873
+3.141
-247.76%
jan 1, 2012
6.397
+4.524
241.53%
jan 1, 2013
1.735
-4.662
-72.88%
jan 1, 2014
2.453
+0.718
41.38%
jan 1, 2015
5.962
+3.509
143.06%
Ranking of countries by current statistics by years


Comments: