29
/
en
AIzaSyAYiBZKx7MnpbEhh9jyipgxe19OcubqV5w
April 1, 2024
46814
Lower middle income
LMC
false
2
1
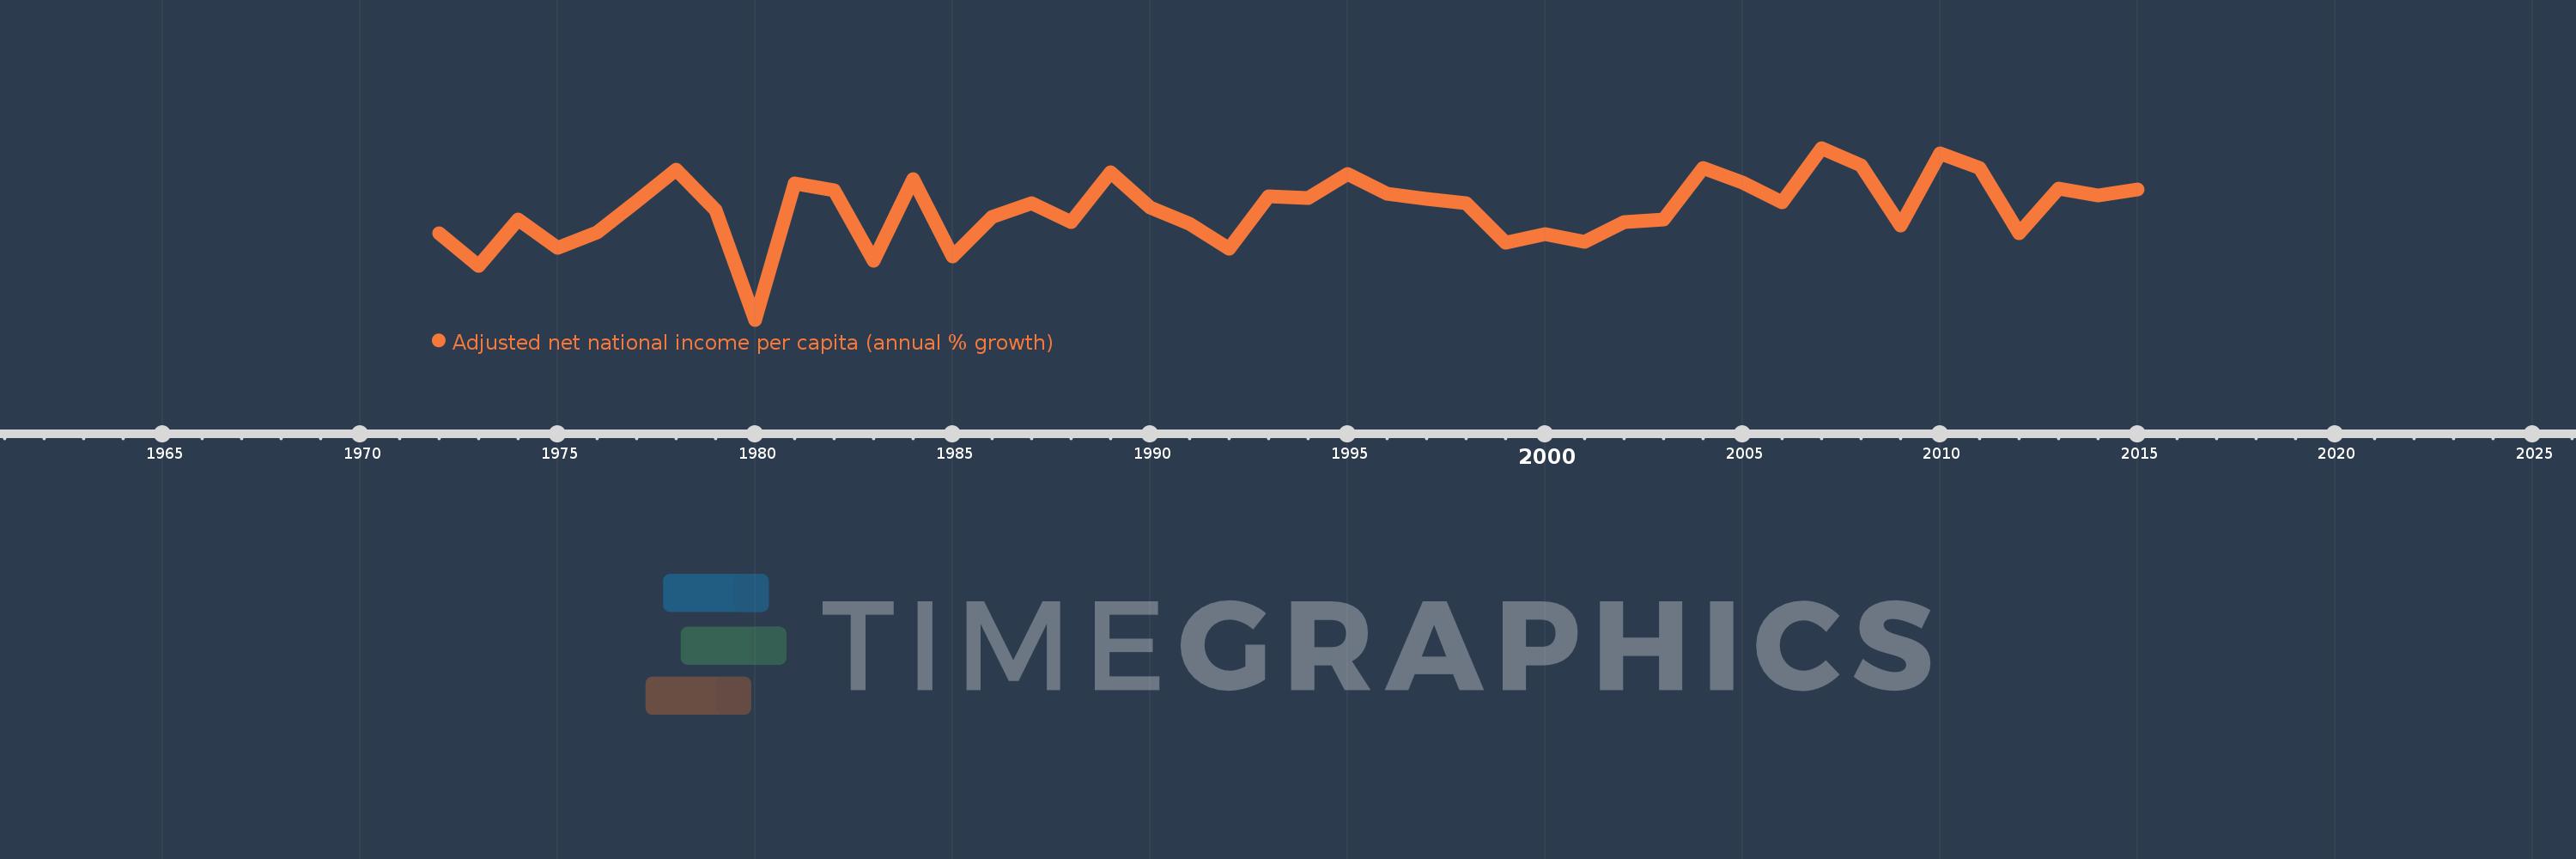
Adjusted net national income per capita (annual % growth)
2015,2014,2013,2012,2011,2010,2009,2008,2007,2006,2005,2004,2003,2002,2001,2000,1999,1998,1997,1996,1995,1994,1993,1992,1991,1990,1989,1988,1987,1986,1985,1984,1983,1982,1981,1980,1979,1978,1977,1976,1975,1974,1973,1972
This statistics in other country:
Timeline:
This timeline shows a graph from 1972 to 2015 of Lower middle income. No data until 1971. Number of actual observations by date: 44.
Source name:
World Development Indicators
Source organization:
World Bank staff estimates based on sources and methods in World Bank's "The Changing Wealth of Nations: Measuring Sustainable Development in the New Millennium" (2011).
Categories, topics:
Economy & Growth
Last updated:
apr 23, 2017
Indicators value changes by year
Minimum:
-5.276
jan 1, 1980
At the date of observation
Value
Absolute change
Change from previous value
jan 1, 1972
1.191
+1.191
0.0%
jan 1, 1973
-1.217
-2.409
-202.21%
jan 1, 1974
2.206
+3.424
-281.23%
jan 1, 1975
0.11
-2.096
-95.01%
jan 1, 1976
1.242
+1.132
1.03K%
jan 1, 1977
3.608
+2.366
190.41%
jan 1, 1978
5.981
+2.372
65.75%
jan 1, 1979
2.929
-3.052
-51.03%
jan 1, 1980
-5.276
-8.205
-280.14%
jan 1, 1981
4.93
+10.206
-193.44%
jan 1, 1982
4.402
-0.528
-10.72%
jan 1, 1983
-0.835
-5.237
-118.97%
jan 1, 1984
5.231
+6.066
-726.44%
jan 1, 1985
-0.541
-5.772
-110.34%
jan 1, 1986
2.459
+3.0
-554.56%
jan 1, 1987
3.446
+0.987
40.15%
jan 1, 1988
2.014
-1.432
-41.55%
jan 1, 1989
5.787
+3.772
187.28%
jan 1, 1990
3.147
-2.639
-45.61%
jan 1, 1991
1.912
-1.236
-39.26%
jan 1, 1992
0.021
-1.891
-98.89%
jan 1, 1993
4.004
+3.982
18.75K%
jan 1, 1994
3.869
-0.134
-3.35%
jan 1, 1995
5.618
+1.748
45.18%
jan 1, 1996
4.155
-1.463
-26.05%
jan 1, 1997
3.754
-0.4
-9.64%
jan 1, 1998
3.484
-0.27
-7.19%
jan 1, 1999
0.466
-3.018
-86.62%
jan 1, 2000
1.138
+0.672
144.13%
jan 1, 2001
0.568
-0.57
-50.08%
jan 1, 2002
2.051
+1.482
260.83%
jan 1, 2003
2.229
+0.179
8.72%
jan 1, 2004
6.099
+3.87
173.58%
jan 1, 2005
4.976
-1.123
-18.41%
jan 1, 2006
3.538
-1.438
-28.9%
jan 1, 2007
7.596
+4.058
114.69%
jan 1, 2008
6.305
-1.291
-17.0%
jan 1, 2009
1.784
-4.521
-71.71%
jan 1, 2010
7.162
+5.378
301.53%
jan 1, 2011
6.07
-1.092
-15.25%
jan 1, 2012
1.2
-4.87
-80.23%
jan 1, 2013
4.556
+3.356
279.62%
jan 1, 2014
4.039
-0.516
-11.33%
jan 1, 2015
4.48
+0.441
10.91%
Ranking of countries by current statistics by years


Comments: