29
/
en
AIzaSyAYiBZKx7MnpbEhh9jyipgxe19OcubqV5w
April 1, 2024
202490
Mozambique
MOZ
true
2
1
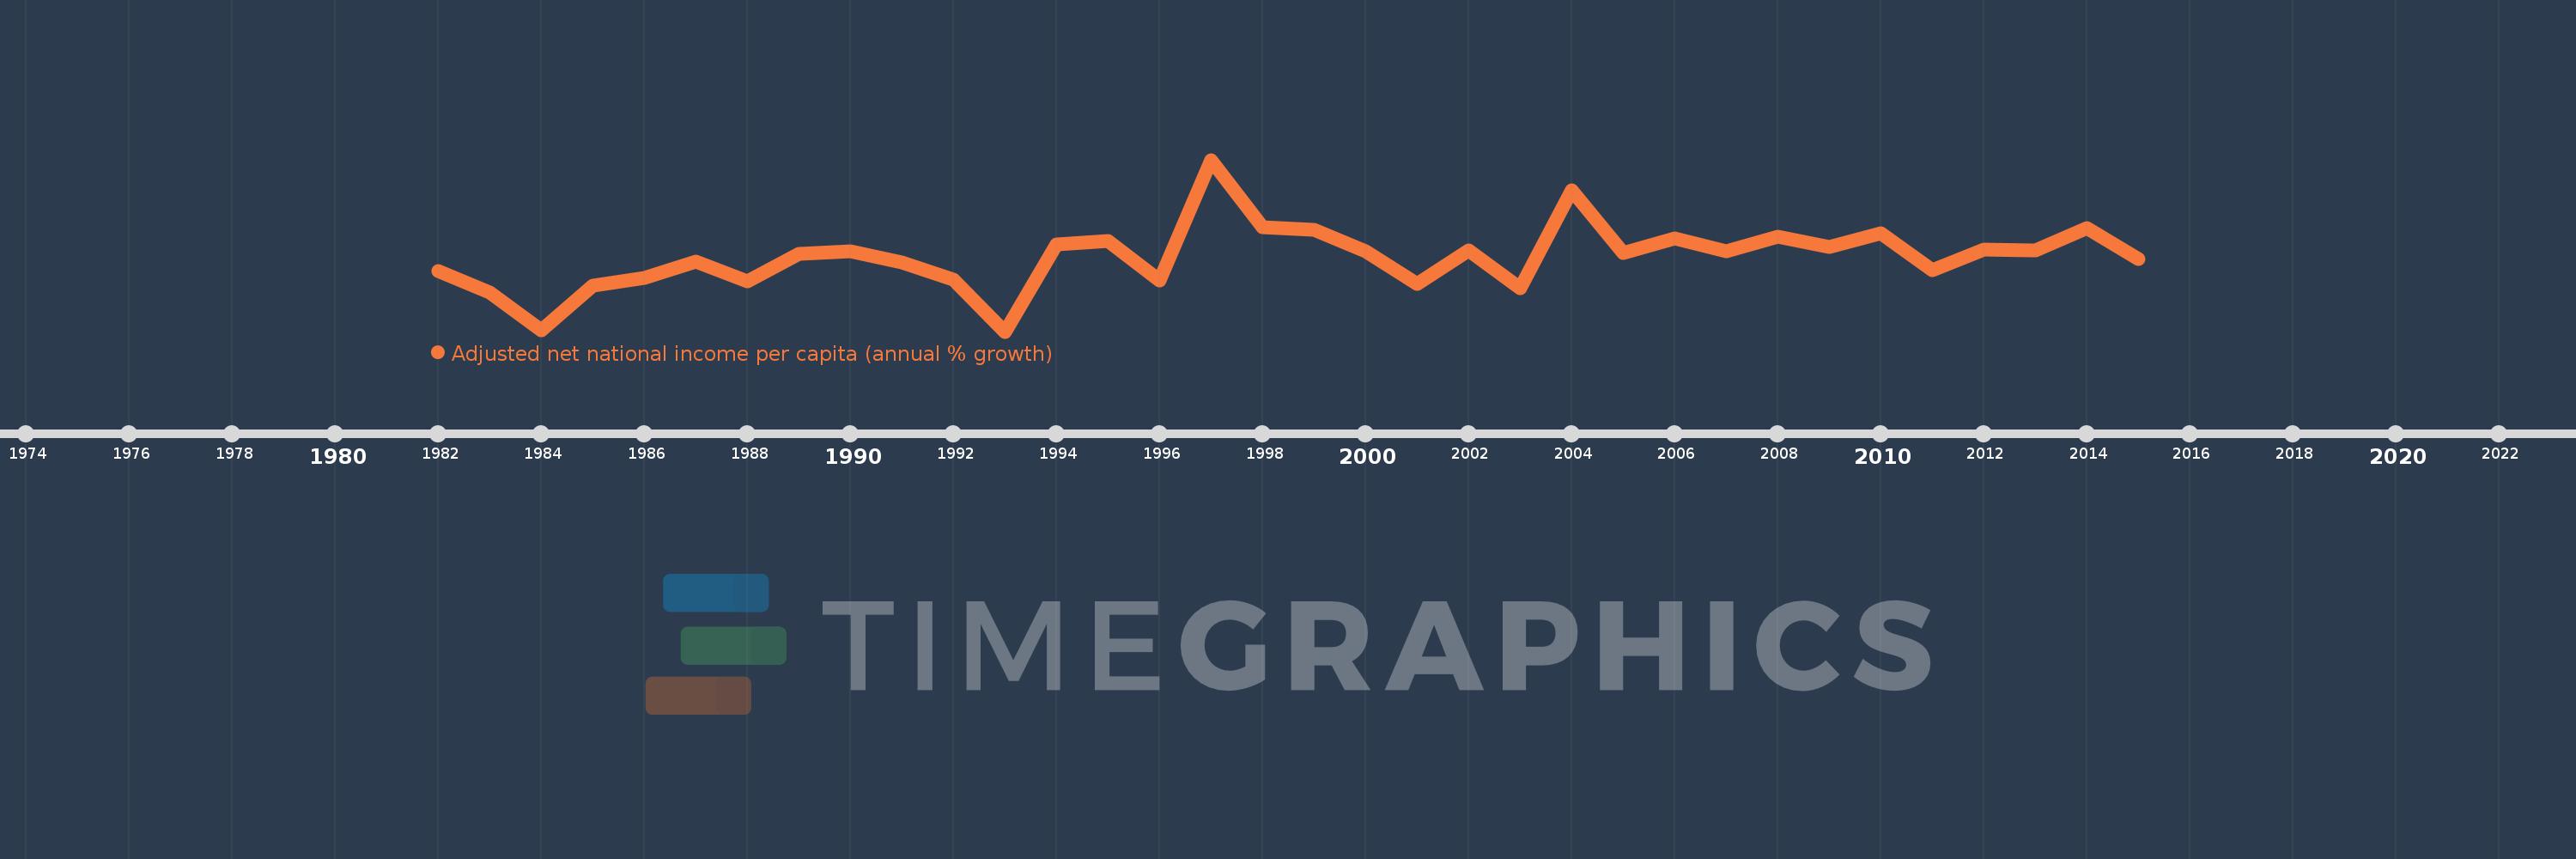
Adjusted net national income per capita (annual % growth)
2015,2014,2013,2012,2011,2010,2009,2008,2007,2006,2005,2004,2003,2002,2001,2000,1999,1998,1997,1996,1995,1994,1993,1992,1991,1990,1989,1988,1987,1986,1985,1984,1983,1982
This statistics in other country:
Timeline:
This timeline shows a graph from 1982 to 2015 of Mozambique. No data until 1981. Number of actual observations by date: 34.
Source name:
World Development Indicators
Source organization:
World Bank staff estimates based on sources and methods in World Bank's "The Changing Wealth of Nations: Measuring Sustainable Development in the New Millennium" (2011).
Categories, topics:
Economy & Growth
Last updated:
apr 23, 2017
Indicators value changes by year
Minimum:
-18.596
jan 1, 1993
Maximum:
29.601
jan 1, 1997
At the date of observation
Value
Absolute change
Change from previous value
jan 1, 1982
-1.67
-1.67
0.0%
jan 1, 1983
-7.545
-5.876
351.91%
jan 1, 1984
-18.299
-10.754
142.52%
jan 1, 1985
-5.775
+12.524
-68.44%
jan 1, 1986
-3.631
+2.144
-37.13%
jan 1, 1987
1.025
+4.656
-128.25%
jan 1, 1988
-4.54
-5.565
-542.72%
jan 1, 1989
3.093
+7.633
-168.13%
jan 1, 1990
3.896
+0.803
25.95%
jan 1, 1991
0.77
-3.126
-80.24%
jan 1, 1992
-3.897
-4.667
-606.3%
jan 1, 1993
-18.596
-14.699
377.17%
jan 1, 1994
5.774
+24.37
-131.05%
jan 1, 1995
6.836
+1.063
18.4%
jan 1, 1996
-4.209
-11.045
-161.56%
jan 1, 1997
29.601
+33.81
-803.35%
jan 1, 1998
10.717
-18.884
-63.8%
jan 1, 1999
9.893
-0.823
-7.68%
jan 1, 2000
4.038
-5.855
-59.18%
jan 1, 2001
-5.246
-9.284
-229.91%
jan 1, 2002
4.18
+9.426
-179.69%
jan 1, 2003
-6.372
-10.552
-252.44%
jan 1, 2004
20.943
+27.315
-428.66%
jan 1, 2005
3.518
-17.425
-83.2%
jan 1, 2006
7.557
+4.038
114.77%
jan 1, 2007
3.967
-3.589
-47.5%
jan 1, 2008
7.946
+3.978
100.27%
jan 1, 2009
5.132
-2.814
-35.41%
jan 1, 2010
8.985
+3.853
75.08%
jan 1, 2011
-1.317
-10.302
-114.66%
jan 1, 2012
4.456
+5.774
-438.35%
jan 1, 2013
4.14
-0.317
-7.11%
jan 1, 2014
10.406
+6.266
151.38%
jan 1, 2015
1.761
-8.645
-83.08%
Ranking of countries by current statistics by years


Comments: