29
/
en
AIzaSyAYiBZKx7MnpbEhh9jyipgxe19OcubqV5w
April 1, 2024
32351
Europe & Central Asia (IDA & IBRD countries)
TEC
false
2
1
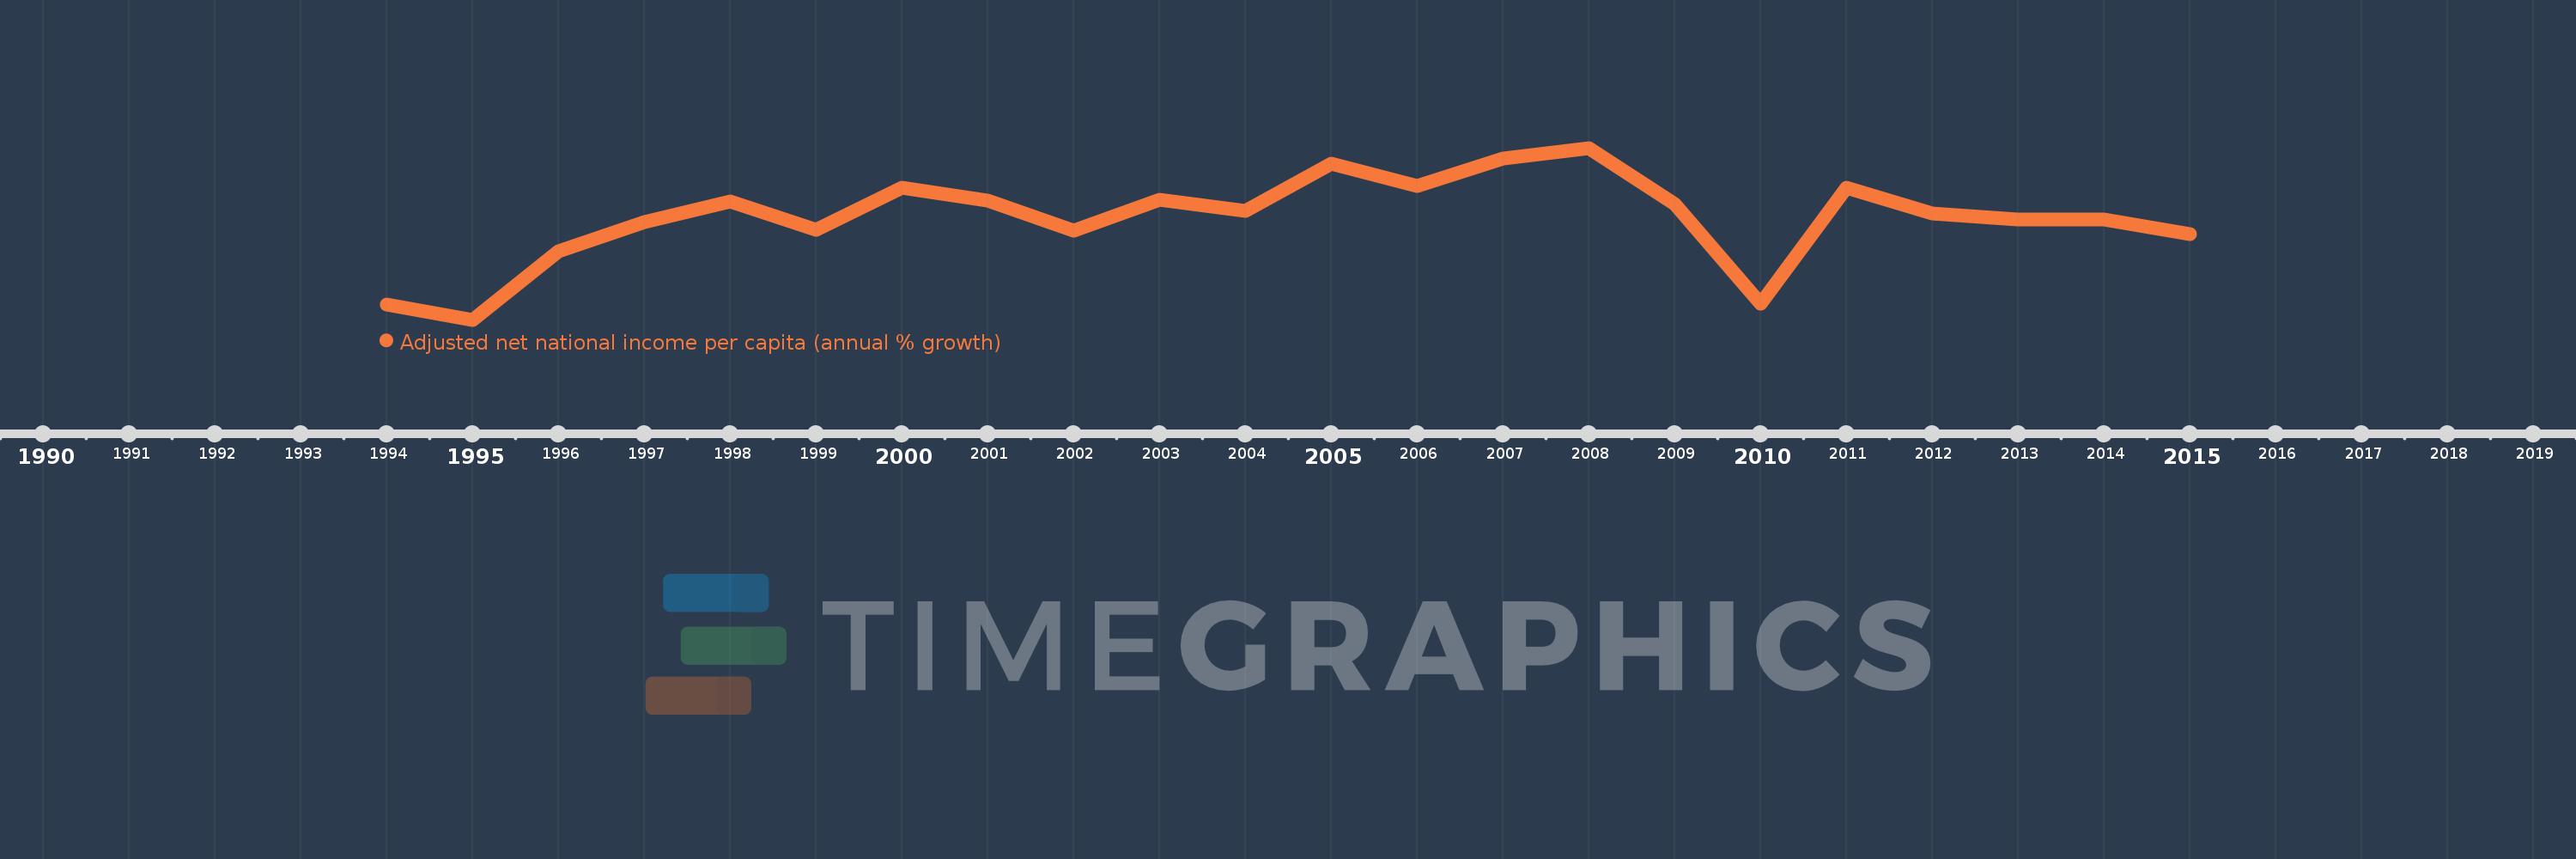
Adjusted net national income per capita (annual % growth)
2015,2014,2013,2012,2011,2010,2009,2008,2007,2006,2005,2004,2003,2002,2001,2000,1999,1998,1997,1996,1995,1994
This statistics in other country:
Timeline:
This timeline shows a graph from 1994 to 2015 of Europe & Central Asia (IDA & IBRD countries). No data until 1993. Number of actual observations by date: 22.
Source name:
World Development Indicators
Source organization:
World Bank staff estimates based on sources and methods in World Bank's "The Changing Wealth of Nations: Measuring Sustainable Development in the New Millennium" (2011).
Categories, topics:
Economy & Growth
Last updated:
apr 23, 2017
Indicators value changes by year
Minimum:
-8.369
jan 1, 1995
Maximum:
10.833
jan 1, 2008
At the date of observation
Value
Absolute change
Change from previous value
jan 1, 1994
-6.651
-6.651
0.0%
jan 1, 1995
-8.369
-1.718
25.82%
jan 1, 1996
-0.743
+7.625
-91.12%
jan 1, 1997
2.533
+3.277
-440.75%
jan 1, 1998
4.838
+2.305
90.96%
jan 1, 1999
1.645
-3.193
-65.99%
jan 1, 2000
6.426
+4.781
290.56%
jan 1, 2001
4.922
-1.505
-23.41%
jan 1, 2002
1.54
-3.382
-68.71%
jan 1, 2003
5.072
+3.532
229.35%
jan 1, 2004
3.829
-1.244
-24.52%
jan 1, 2005
9.042
+5.214
136.18%
jan 1, 2006
6.572
-2.47
-27.32%
jan 1, 2007
9.682
+3.11
47.32%
jan 1, 2008
10.833
+1.152
11.89%
jan 1, 2009
4.598
-6.236
-57.56%
jan 1, 2010
-6.608
-11.206
-243.74%
jan 1, 2011
6.342
+12.951
-195.97%
jan 1, 2012
3.486
-2.856
-45.04%
jan 1, 2013
2.883
-0.603
-17.29%
jan 1, 2014
2.863
-0.02
-0.7%
jan 1, 2015
1.217
-1.646
-57.51%
Ranking of countries by current statistics by years


Comments: