29
/
en
AIzaSyAYiBZKx7MnpbEhh9jyipgxe19OcubqV5w
April 1, 2024
228053
Romania
ROU
true
2
1
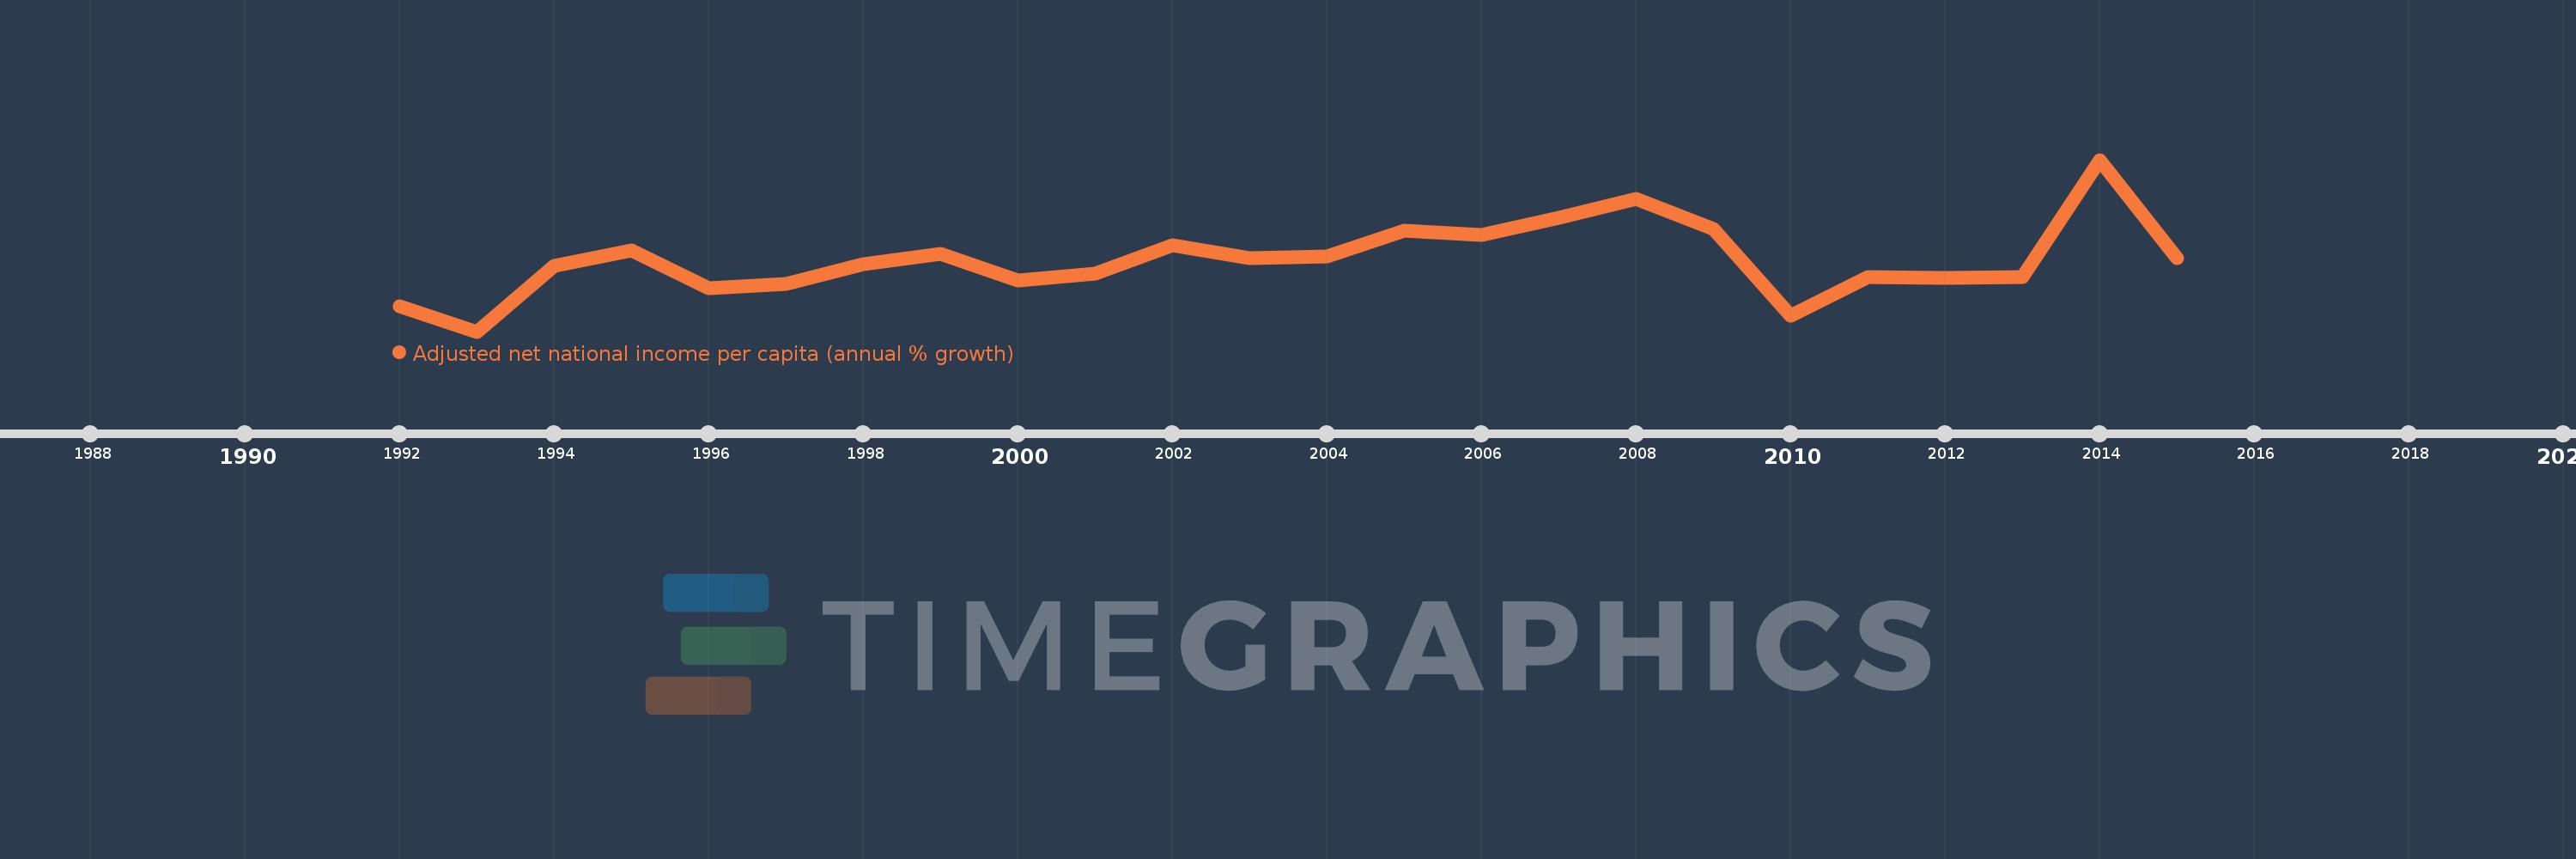
Adjusted net national income per capita (annual % growth)
2015,2014,2013,2012,2011,2010,2009,2008,2007,2006,2005,2004,2003,2002,2001,2000,1999,1998,1997,1996,1995,1994,1993,1992
This statistics in other country:
Timeline:
This timeline shows a graph from 1992 to 2015 of Romania. No data until 1991. Number of actual observations by date: 24.
Source name:
World Development Indicators
Source organization:
World Bank staff estimates based on sources and methods in World Bank's "The Changing Wealth of Nations: Measuring Sustainable Development in the New Millennium" (2011).
Categories, topics:
Economy & Growth
Last updated:
apr 23, 2017
Indicators value changes by year
Minimum:
-10.85
jan 1, 1993
Maximum:
26.607
jan 1, 2014
At the date of observation
Value
Absolute change
Change from previous value
jan 1, 1992
-5.311
-5.311
0.0%
jan 1, 1993
-10.85
-5.539
104.29%
jan 1, 1994
3.552
+14.402
-132.74%
jan 1, 1995
6.785
+3.233
91.02%
jan 1, 1996
-1.46
-8.245
-121.51%
jan 1, 1997
-0.369
+1.091
-74.72%
jan 1, 1998
3.915
+4.284
-1.16K%
jan 1, 1999
6.151
+2.236
57.1%
jan 1, 2000
0.379
-5.772
-93.84%
jan 1, 2001
1.884
+1.506
397.69%
jan 1, 2002
8.03
+6.146
326.19%
jan 1, 2003
5.071
-2.959
-36.85%
jan 1, 2004
5.505
+0.434
8.56%
jan 1, 2005
11.207
+5.702
103.58%
jan 1, 2006
10.171
-1.036
-9.25%
jan 1, 2007
13.885
+3.715
36.52%
jan 1, 2008
18.013
+4.128
29.73%
jan 1, 2009
11.548
-6.466
-35.89%
jan 1, 2010
-7.415
-18.963
-164.21%
jan 1, 2011
1.042
+8.457
-114.06%
jan 1, 2012
0.895
-0.147
-14.09%
jan 1, 2013
1.05
+0.154
17.25%
jan 1, 2014
26.607
+25.557
2.43K%
jan 1, 2015
5.091
-21.516
-80.86%
Ranking of countries by current statistics by years


Comments: