29
/
en
AIzaSyAYiBZKx7MnpbEhh9jyipgxe19OcubqV5w
April 1, 2024
167049
Kenya
KEN
true
2
1
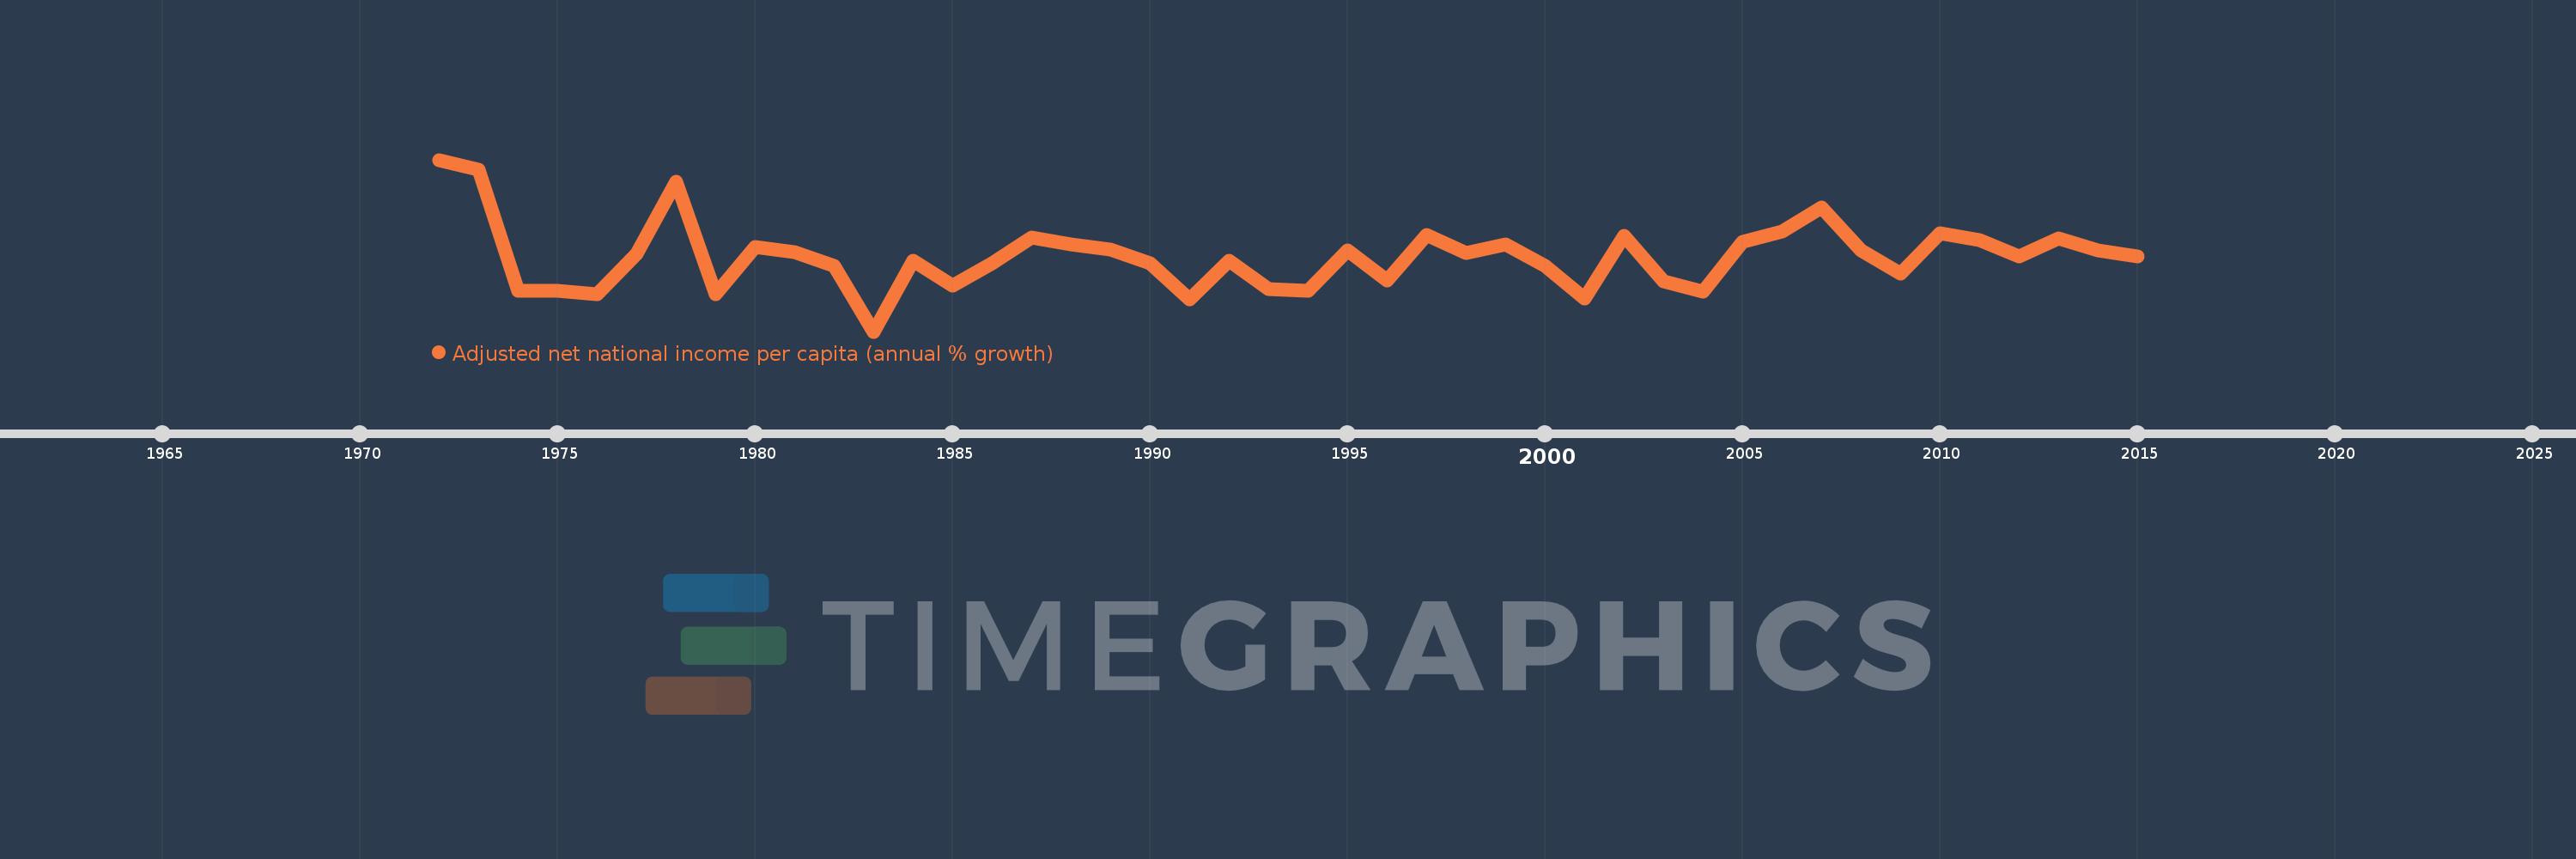
Adjusted net national income per capita (annual % growth)
2015,2014,2013,2012,2011,2010,2009,2008,2007,2006,2005,2004,2003,2002,2001,2000,1999,1998,1997,1996,1995,1994,1993,1992,1991,1990,1989,1988,1987,1986,1985,1984,1983,1982,1981,1980,1979,1978,1977,1976,1975,1974,1973,1972
This statistics in other country:
Timeline:
This timeline shows a graph from 1972 to 2015 of Kenya. No data until 1971. Number of actual observations by date: 44.
Source name:
World Development Indicators
Source organization:
World Bank staff estimates based on sources and methods in World Bank's "The Changing Wealth of Nations: Measuring Sustainable Development in the New Millennium" (2011).
Categories, topics:
Economy & Growth
Last updated:
apr 23, 2017
Indicators value changes by year
Minimum:
-9.535
jan 1, 1983
Maximum:
15.806
jan 1, 1972
At the date of observation
Value
Absolute change
Change from previous value
jan 1, 1972
15.806
+15.806
0.0%
jan 1, 1973
14.329
-1.477
-9.35%
jan 1, 1974
-3.501
-17.83
-124.43%
jan 1, 1975
-3.462
+0.039
-1.12%
jan 1, 1976
-4.014
-0.552
15.95%
jan 1, 1977
1.869
+5.883
-146.56%
jan 1, 1978
12.539
+10.67
570.89%
jan 1, 1979
-3.972
-16.511
-131.68%
jan 1, 1980
2.901
+6.874
-173.04%
jan 1, 1981
2.148
-0.753
-25.97%
jan 1, 1982
0.103
-2.045
-95.22%
jan 1, 1983
-9.535
-9.638
-9.39K%
jan 1, 1984
0.941
+10.476
-109.87%
jan 1, 1985
-2.695
-3.636
-386.53%
jan 1, 1986
0.53
+3.226
-119.67%
jan 1, 1987
4.365
+3.835
723.16%
jan 1, 1988
3.357
-1.009
-23.1%
jan 1, 1989
2.538
-0.819
-24.39%
jan 1, 1990
0.551
-1.986
-78.27%
jan 1, 1991
-4.728
-5.279
-957.21%
jan 1, 1992
0.919
+5.646
-119.43%
jan 1, 1993
-3.212
-4.13
-449.67%
jan 1, 1994
-3.55
-0.338
10.54%
jan 1, 1995
2.395
+5.945
-167.46%
jan 1, 1996
-1.99
-4.385
-183.09%
jan 1, 1997
4.677
+6.667
-335.02%
jan 1, 1998
2.052
-2.625
-56.12%
jan 1, 1999
3.264
+1.212
59.03%
jan 1, 2000
0.221
-3.043
-93.23%
jan 1, 2001
-4.603
-4.824
-2.18K%
jan 1, 2002
4.626
+9.229
-200.48%
jan 1, 2003
-2.171
-6.796
-146.93%
jan 1, 2004
-3.602
-1.431
65.94%
jan 1, 2005
3.727
+7.329
-203.47%
jan 1, 2006
5.186
+1.459
39.15%
jan 1, 2007
8.742
+3.556
68.56%
jan 1, 2008
2.422
-6.32
-72.3%
jan 1, 2009
-0.961
-3.382
-139.66%
jan 1, 2010
4.931
+5.892
-613.37%
jan 1, 2011
3.955
-0.976
-19.8%
jan 1, 2012
1.612
-2.343
-59.25%
jan 1, 2013
4.156
+2.545
157.9%
jan 1, 2014
2.413
-1.743
-41.95%
jan 1, 2015
1.532
-0.88
-36.49%
Ranking of countries by current statistics by years


Comments: