29
/
en
AIzaSyAYiBZKx7MnpbEhh9jyipgxe19OcubqV5w
April 1, 2024
260454
Tanzania
TZA
true
2
1
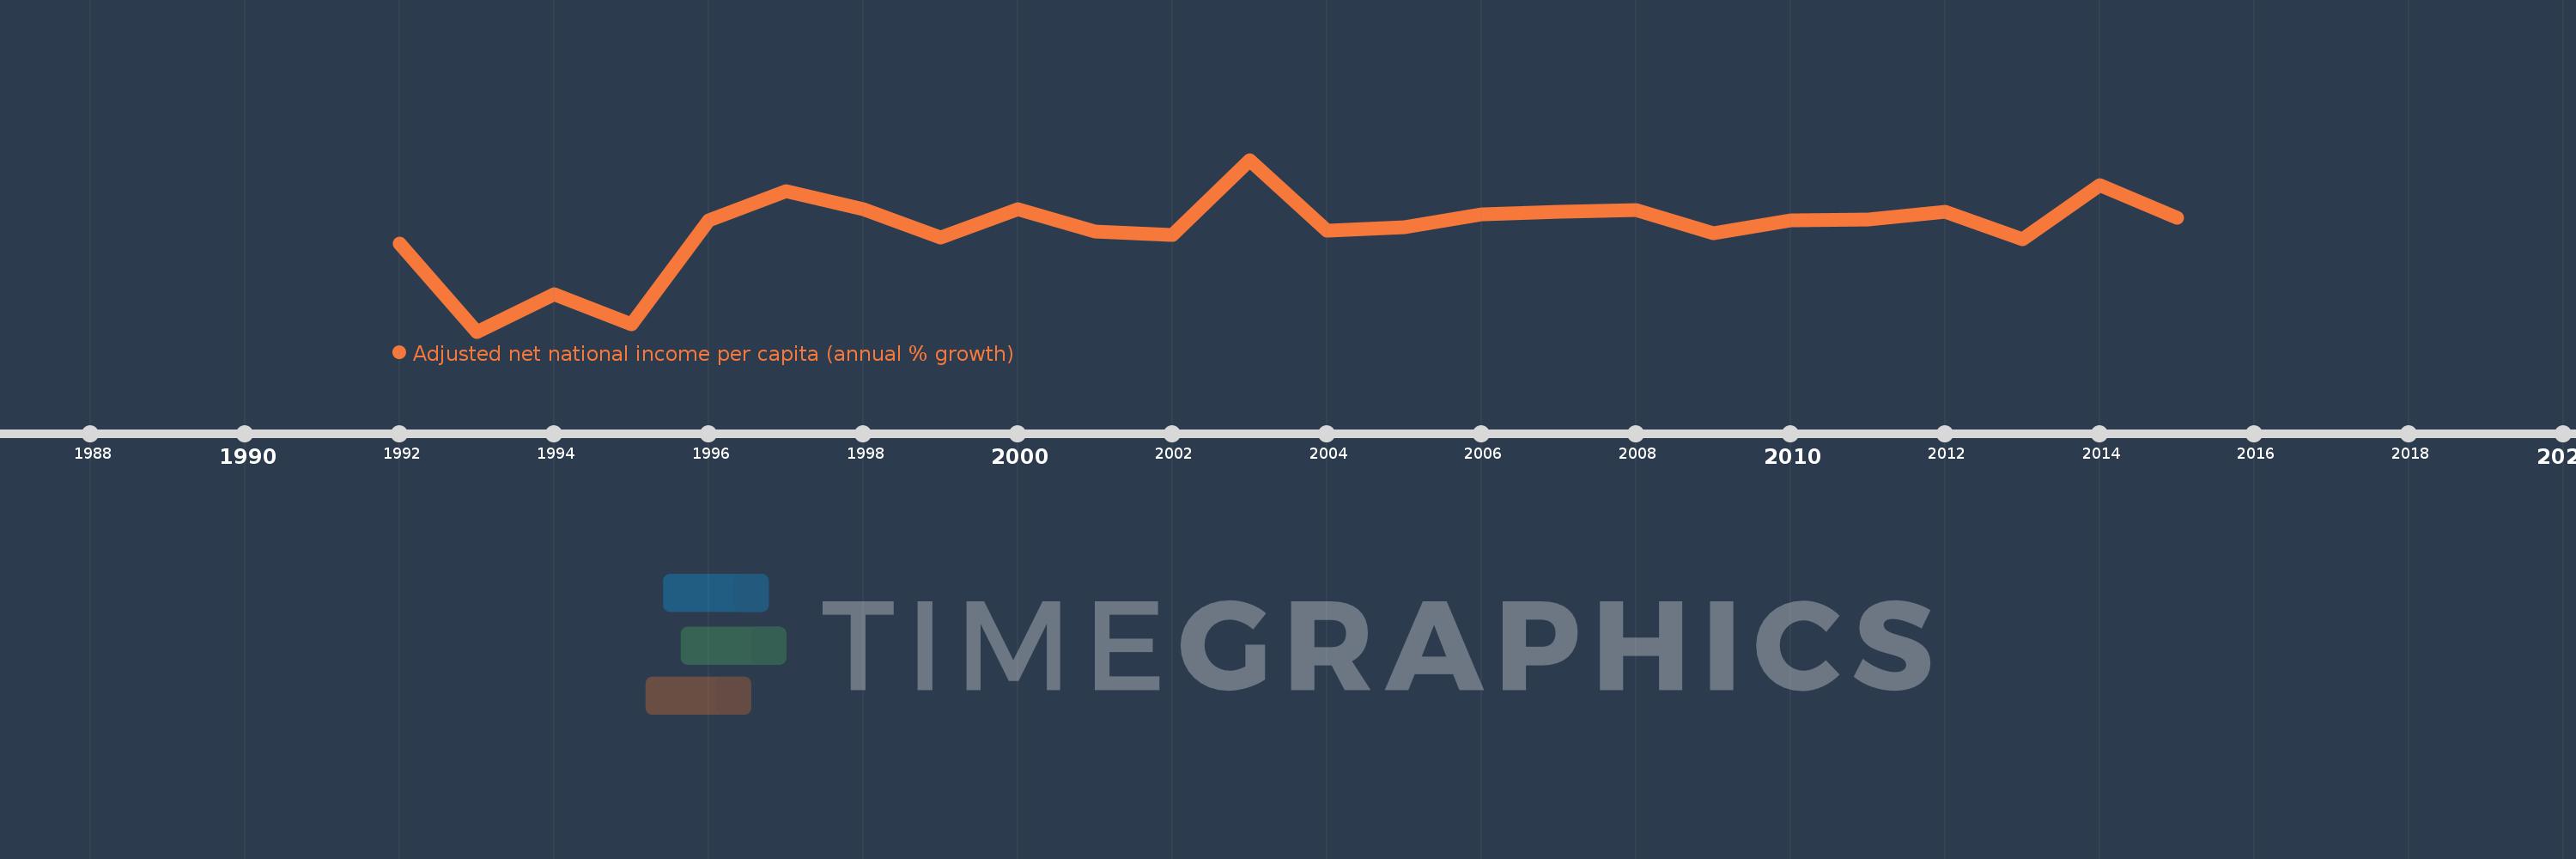
Adjusted net national income per capita (annual % growth)
2015,2014,2013,2012,2011,2010,2009,2008,2007,2006,2005,2004,2003,2002,2001,2000,1999,1998,1997,1996,1995,1994,1993,1992
This statistics in other country:
Timeline:
This timeline shows a graph from 1992 to 2015 of Tanzania. No data until 1991. Number of actual observations by date: 24.
Source name:
World Development Indicators
Source organization:
World Bank staff estimates based on sources and methods in World Bank's "The Changing Wealth of Nations: Measuring Sustainable Development in the New Millennium" (2011).
Categories, topics:
Economy & Growth
Last updated:
apr 23, 2017
Indicators value changes by year
Minimum:
-7.441
jan 1, 1993
At the date of observation
Value
Absolute change
Change from previous value
jan 1, 1992
1.206
+1.206
0.0%
jan 1, 1993
-7.441
-8.647
-717.22%
jan 1, 1994
-3.785
+3.656
-49.13%
jan 1, 1995
-6.7
-2.915
77.01%
jan 1, 1996
3.575
+10.275
-153.35%
jan 1, 1997
6.387
+2.812
78.66%
jan 1, 1998
4.631
-1.755
-27.48%
jan 1, 1999
1.832
-2.8
-60.45%
jan 1, 2000
4.606
+2.774
151.45%
jan 1, 2001
2.442
-2.164
-46.98%
jan 1, 2002
2.128
-0.314
-12.86%
jan 1, 2003
9.508
+7.38
346.77%
jan 1, 2004
2.496
-7.012
-73.75%
jan 1, 2005
2.814
+0.319
12.77%
jan 1, 2006
4.135
+1.321
46.93%
jan 1, 2007
4.389
+0.254
6.13%
jan 1, 2008
4.576
+0.187
4.26%
jan 1, 2009
2.279
-2.297
-50.2%
jan 1, 2010
3.518
+1.239
54.38%
jan 1, 2011
3.612
+0.095
2.69%
jan 1, 2012
4.411
+0.799
22.11%
jan 1, 2013
1.663
-2.748
-62.29%
jan 1, 2014
7.009
+5.346
321.35%
jan 1, 2015
3.83
-3.179
-45.36%
Ranking of countries by current statistics by years


Comments: