29
/
en
AIzaSyAYiBZKx7MnpbEhh9jyipgxe19OcubqV5w
April 1, 2024
110531
Congo, Rep.
COG
true
2
1
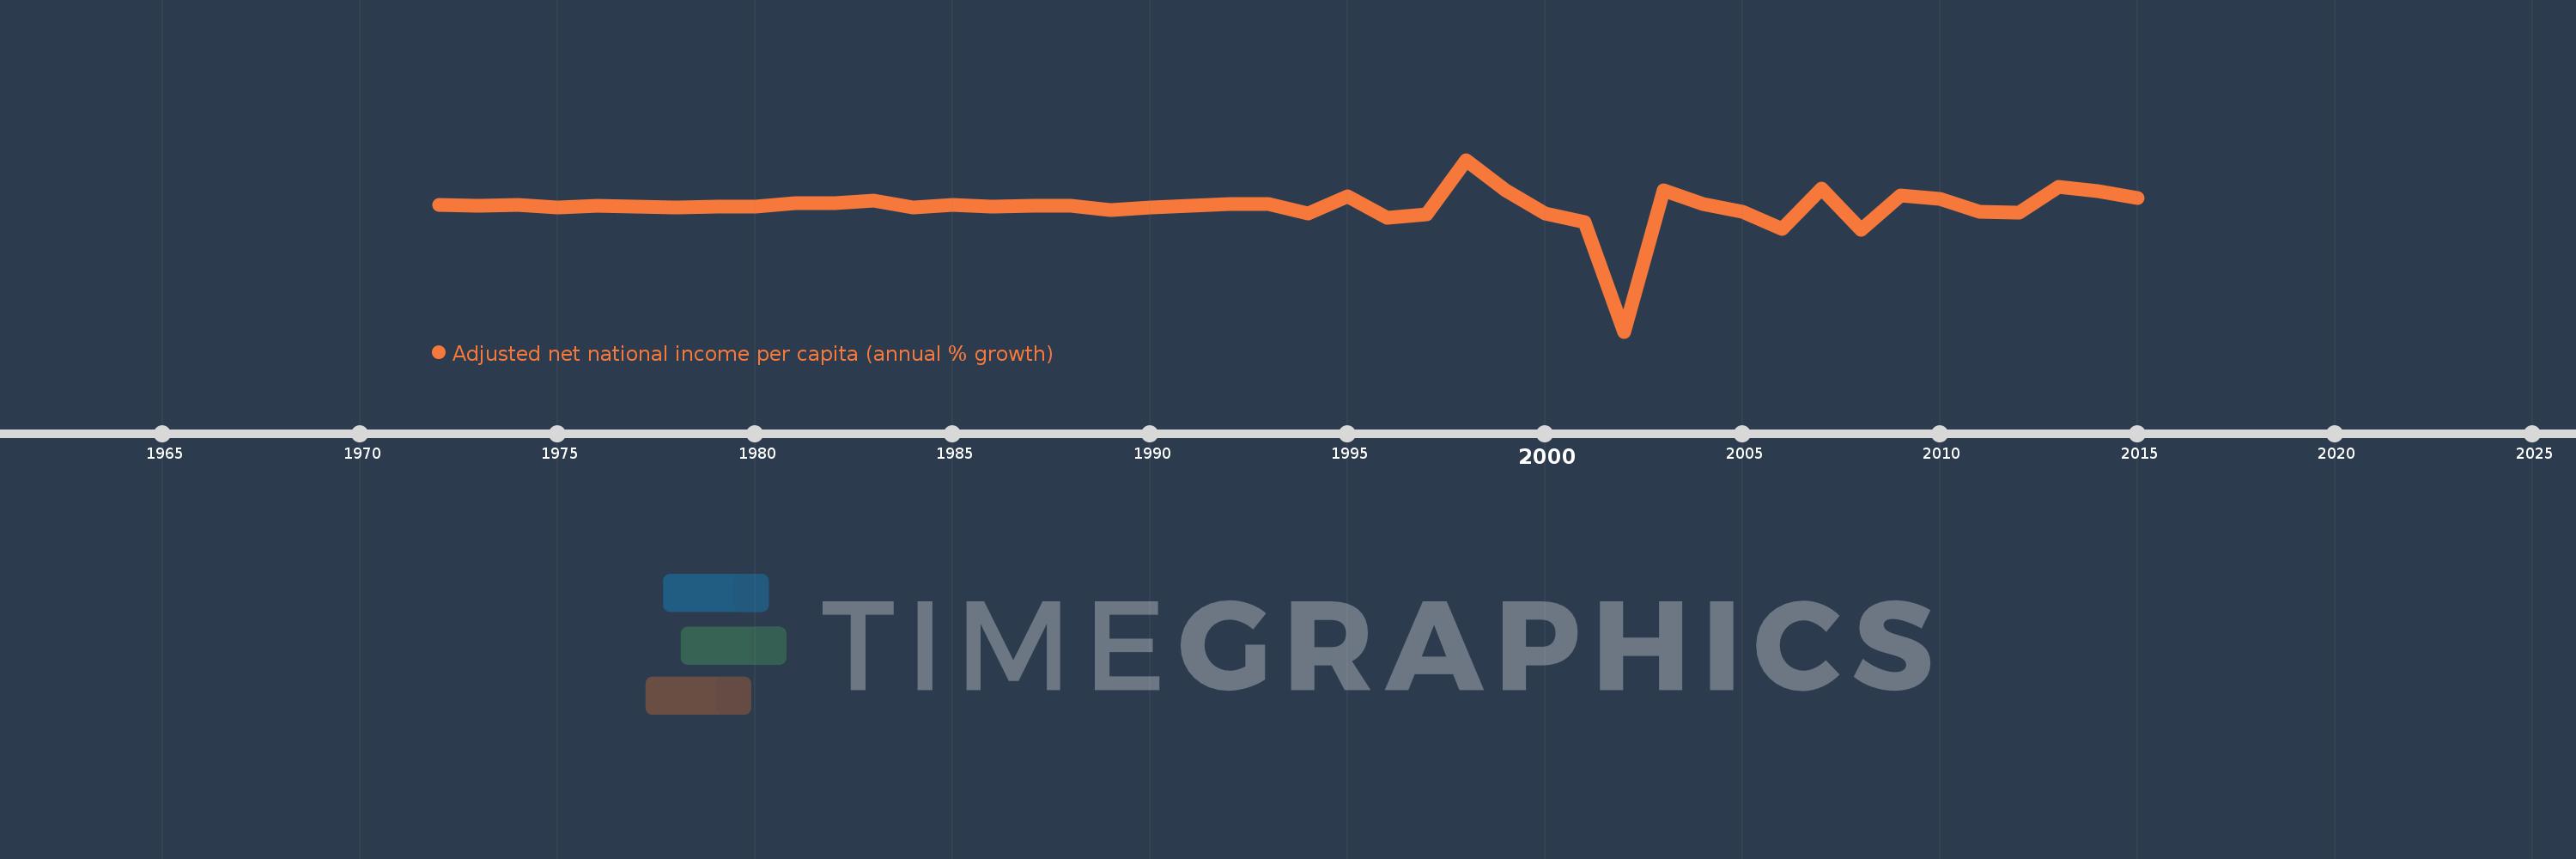
Adjusted net national income per capita (annual % growth)
2015,2014,2013,2012,2011,2010,2009,2008,2007,2006,2005,2004,2003,2002,2001,2000,1999,1998,1997,1996,1995,1994,1993,1992,1991,1990,1989,1988,1987,1986,1985,1984,1983,1982,1981,1980,1979,1978,1977,1976,1975,1974,1973,1972
This statistics in other country:
Timeline:
This timeline shows a graph from 1972 to 2015 of Congo, Rep.. No data until 1971. Number of actual observations by date: 44.
Source name:
World Development Indicators
Source organization:
World Bank staff estimates based on sources and methods in World Bank's "The Changing Wealth of Nations: Measuring Sustainable Development in the New Millennium" (2011).
Categories, topics:
Economy & Growth
Last updated:
apr 23, 2017
Indicators value changes by year
Minimum:
-866.309
jan 1, 2002
Maximum:
316.023
jan 1, 1998
At the date of observation
Value
Absolute change
Change from previous value
jan 1, 1972
4.716
+4.716
0.0%
jan 1, 1973
-2.315
-7.03
-149.09%
jan 1, 1974
4.075
+6.39
-276.04%
jan 1, 1975
-11.013
-15.088
-370.25%
jan 1, 1976
-0.239
+10.774
-97.83%
jan 1, 1977
-8.633
-8.394
3.52K%
jan 1, 1978
-11.151
-2.518
29.16%
jan 1, 1979
-7.951
+3.199
-28.69%
jan 1, 1980
-7.261
+0.69
-8.68%
jan 1, 1981
17.141
+24.403
-336.06%
jan 1, 1982
15.31
-1.831
-10.68%
jan 1, 1983
37.979
+22.669
148.07%
jan 1, 1984
-10.979
-48.958
-128.91%
jan 1, 1985
4.698
+15.677
-142.8%
jan 1, 1986
-8.992
-13.69
-291.38%
jan 1, 1987
-1.55
+7.442
-82.76%
jan 1, 1988
-0.045
+1.504
-97.07%
jan 1, 1989
-28.349
-28.304
62.4K%
jan 1, 1990
-10.325
+18.024
-63.58%
jan 1, 1991
1.084
+11.409
-110.5%
jan 1, 1992
9.619
+8.535
787.55%
jan 1, 1993
9.516
-0.103
-1.07%
jan 1, 1994
-55.164
-64.68
-679.71%
jan 1, 1995
66.79
+121.954
-221.07%
jan 1, 1996
-80.215
-147.004
-220.1%
jan 1, 1997
-59.629
+20.586
-25.66%
jan 1, 1998
316.023
+375.652
-629.99%
jan 1, 1999
106.367
-209.657
-66.34%
jan 1, 2000
-56.404
-162.771
-153.03%
jan 1, 2001
-110.345
-53.94
95.63%
jan 1, 2002
-866.309
-755.964
685.09%
jan 1, 2003
107.832
+974.141
-112.45%
jan 1, 2004
10.024
-97.808
-90.7%
jan 1, 2005
-38.887
-48.911
-487.92%
jan 1, 2006
-161.619
-122.732
315.61%
jan 1, 2007
117.46
+279.079
-172.68%
jan 1, 2008
-165.106
-282.566
-240.56%
jan 1, 2009
72.009
+237.115
-143.61%
jan 1, 2010
48.547
-23.462
-32.58%
jan 1, 2011
-41.756
-90.302
-186.01%
jan 1, 2012
-44.667
-2.911
6.97%
jan 1, 2013
132.657
+177.324
-396.99%
jan 1, 2014
97.572
-35.085
-26.45%
jan 1, 2015
50.223
-47.348
-48.53%
Ranking of countries by current statistics by years


Comments: