29
/
en
AIzaSyAYiBZKx7MnpbEhh9jyipgxe19OcubqV5w
April 1, 2024
65626
Algeria
DZA
true
2
1
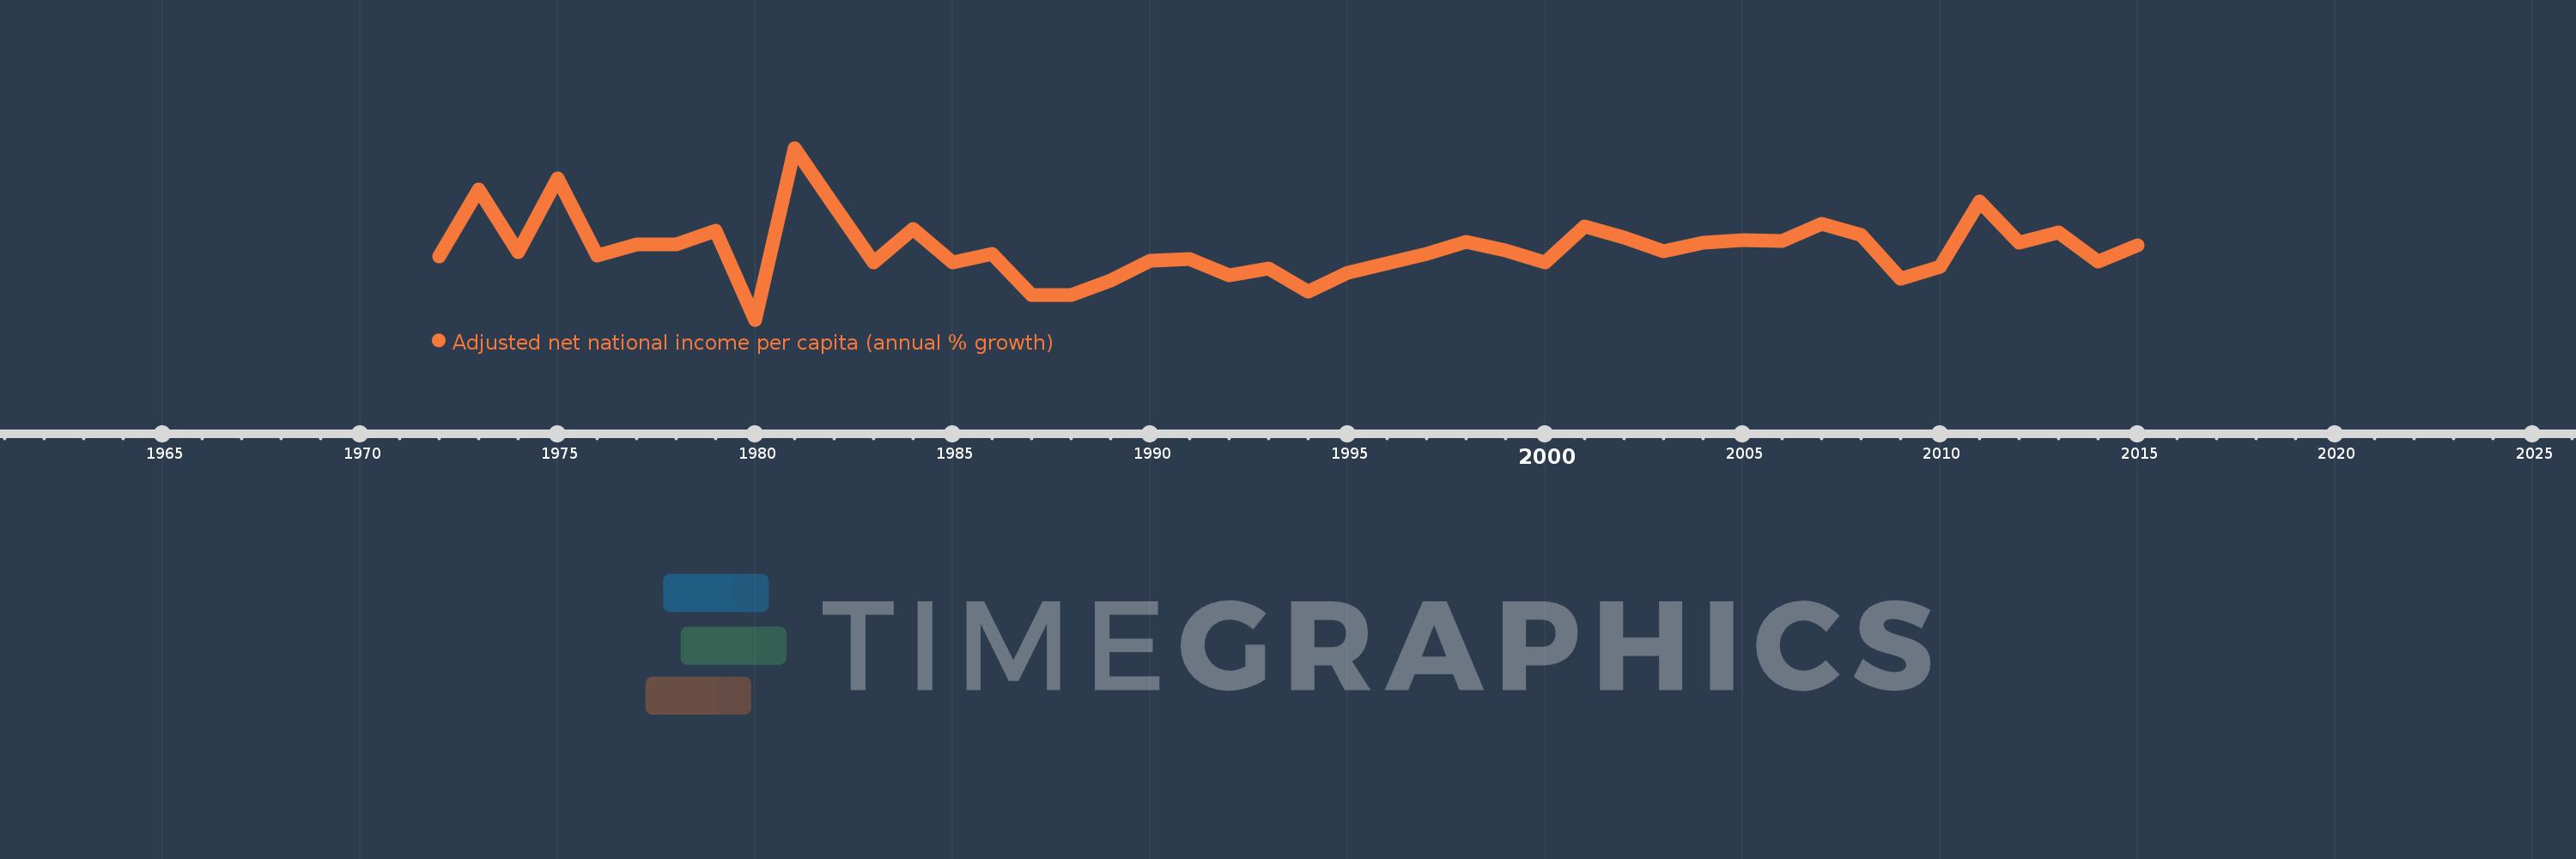
Adjusted net national income per capita (annual % growth)
2015,2014,2013,2012,2011,2010,2009,2008,2007,2006,2005,2004,2003,2002,2001,2000,1999,1998,1997,1996,1995,1994,1993,1992,1991,1990,1989,1988,1987,1986,1985,1984,1983,1982,1981,1980,1979,1978,1977,1976,1975,1974,1973,1972
This statistics in other country:
Timeline:
This timeline shows a graph from 1972 to 2015 of Algeria. No data until 1971. Number of actual observations by date: 44.
Source name:
World Development Indicators
Source organization:
World Bank staff estimates based on sources and methods in World Bank's "The Changing Wealth of Nations: Measuring Sustainable Development in the New Millennium" (2011).
Categories, topics:
Economy & Growth
Last updated:
apr 23, 2017
Indicators value changes by year
Minimum:
-15.278
jan 1, 1980
Maximum:
27.417
jan 1, 1981
At the date of observation
Value
Absolute change
Change from previous value
jan 1, 1972
0.475
+0.475
0.0%
jan 1, 1973
17.069
+16.594
3.49K%
jan 1, 1974
1.418
-15.651
-91.69%
jan 1, 1975
19.846
+18.427
1.3K%
jan 1, 1976
0.585
-19.261
-97.05%
jan 1, 1977
3.446
+2.861
488.86%
jan 1, 1978
3.533
+0.088
2.55%
jan 1, 1979
6.827
+3.293
93.2%
jan 1, 1980
-15.278
-22.104
-323.8%
jan 1, 1981
27.417
+42.695
-279.46%
jan 1, 1982
12.956
-14.461
-52.74%
jan 1, 1983
-1.119
-14.075
-108.64%
jan 1, 1984
7.334
+8.453
-755.49%
jan 1, 1985
-0.99
-8.324
-113.49%
jan 1, 1986
1.044
+2.034
-205.53%
jan 1, 1987
-9.197
-10.241
-980.59%
jan 1, 1988
-9.052
+0.145
-1.57%
jan 1, 1989
-5.517
+3.535
-39.05%
jan 1, 1990
-0.533
+4.983
-90.33%
jan 1, 1991
-0.096
+0.437
-81.97%
jan 1, 1992
-4.246
-4.15
4.32K%
jan 1, 1993
-2.495
+1.751
-41.24%
jan 1, 1994
-8.249
-5.754
230.64%
jan 1, 1995
-3.667
+4.582
-55.55%
jan 1, 1996
-1.347
+2.32
-63.27%
jan 1, 1997
1.017
+2.363
-175.49%
jan 1, 1998
4.041
+3.025
297.52%
jan 1, 1999
1.991
-2.05
-50.72%
jan 1, 2000
-1.119
-3.11
-156.19%
jan 1, 2001
7.857
+8.976
-802.14%
jan 1, 2002
5.06
-2.797
-35.6%
jan 1, 2003
1.788
-3.272
-64.66%
jan 1, 2004
3.897
+2.109
117.92%
jan 1, 2005
4.408
+0.511
13.1%
jan 1, 2006
4.381
-0.027
-0.62%
jan 1, 2007
8.531
+4.151
94.75%
jan 1, 2008
5.827
-2.704
-31.7%
jan 1, 2009
-5.011
-10.838
-186.0%
jan 1, 2010
-2.135
+2.876
-57.39%
jan 1, 2011
14.218
+16.353
-765.92%
jan 1, 2012
3.827
-10.391
-73.08%
jan 1, 2013
6.484
+2.657
69.44%
jan 1, 2014
-0.844
-7.328
-113.02%
jan 1, 2015
3.29
+4.134
-489.86%
Ranking of countries by current statistics by years


Comments: