29
/
en
AIzaSyAYiBZKx7MnpbEhh9jyipgxe19OcubqV5w
April 1, 2024
111809
Costa Rica
CRI
true
2
1
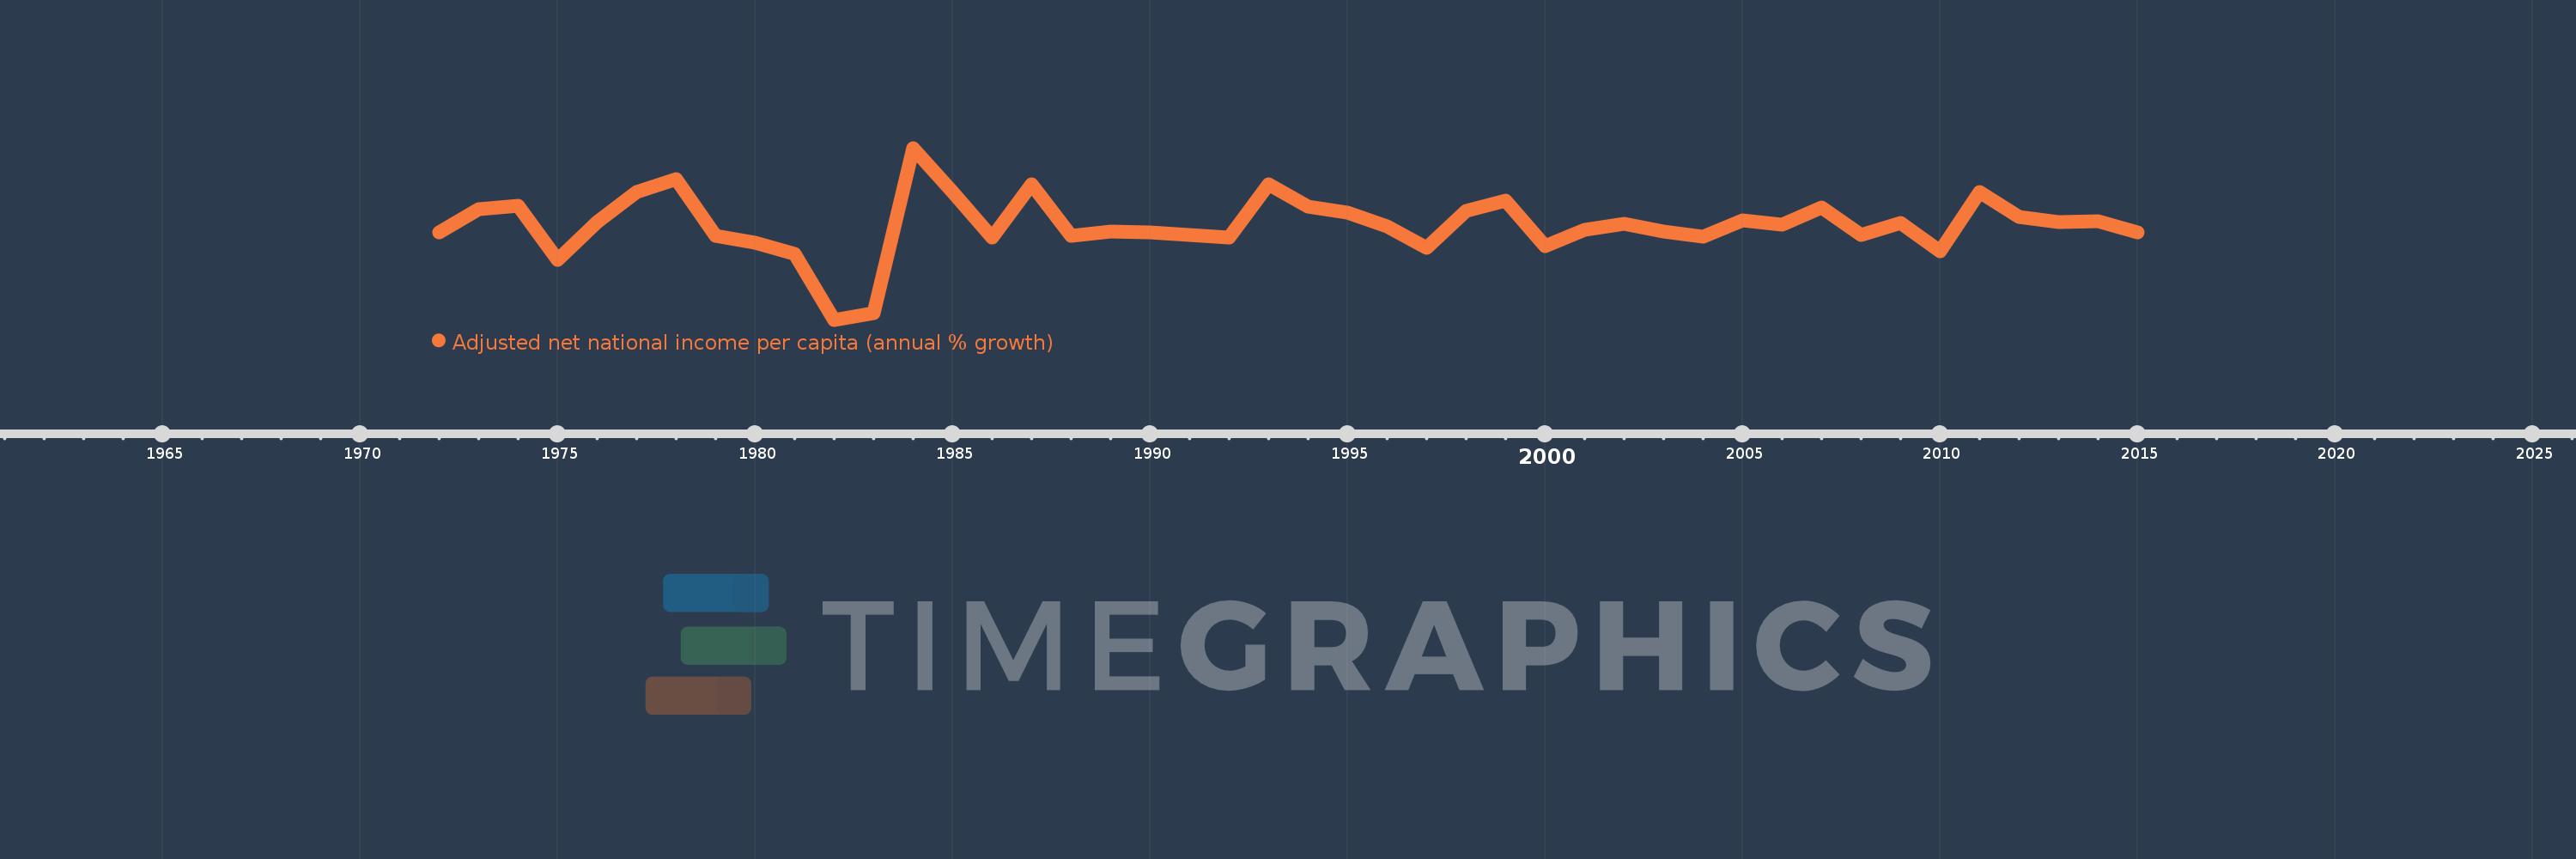
Adjusted net national income per capita (annual % growth)
2015,2014,2013,2012,2011,2010,2009,2008,2007,2006,2005,2004,2003,2002,2001,2000,1999,1998,1997,1996,1995,1994,1993,1992,1991,1990,1989,1988,1987,1986,1985,1984,1983,1982,1981,1980,1979,1978,1977,1976,1975,1974,1973,1972
This statistics in other country:
Timeline:
This timeline shows a graph from 1972 to 2015 of Costa Rica. No data until 1971. Number of actual observations by date: 44.
Source name:
World Development Indicators
Source organization:
World Bank staff estimates based on sources and methods in World Bank's "The Changing Wealth of Nations: Measuring Sustainable Development in the New Millennium" (2011).
Categories, topics:
Economy & Growth
Last updated:
apr 23, 2017
Indicators value changes by year
Minimum:
-14.428
jan 1, 1982
Maximum:
15.791
jan 1, 1984
At the date of observation
Value
Absolute change
Change from previous value
jan 1, 1972
0.893
+0.893
0.0%
jan 1, 1973
4.981
+4.088
457.58%
jan 1, 1974
5.669
+0.688
13.81%
jan 1, 1975
-3.842
-9.511
-167.76%
jan 1, 1976
2.745
+6.587
-171.46%
jan 1, 1977
8.097
+5.351
194.94%
jan 1, 1978
10.278
+2.182
26.94%
jan 1, 1979
0.377
-9.902
-96.34%
jan 1, 1980
-0.836
-1.213
-322.13%
jan 1, 1981
-2.896
-2.059
246.24%
jan 1, 1982
-14.428
-11.532
398.25%
jan 1, 1983
-13.263
+1.165
-8.08%
jan 1, 1984
15.791
+29.054
-219.06%
jan 1, 1985
8.031
-7.76
-49.14%
jan 1, 1986
0.059
-7.972
-99.26%
jan 1, 1987
9.348
+9.289
15.74K%
jan 1, 1988
0.303
-9.044
-96.76%
jan 1, 1989
1.043
+0.74
243.92%
jan 1, 1990
0.955
-0.088
-8.46%
jan 1, 1991
0.428
-0.527
-55.19%
jan 1, 1992
0.05
-0.378
-88.32%
jan 1, 1993
9.372
+9.322
18.65K%
jan 1, 1994
5.409
-3.963
-42.28%
jan 1, 1995
4.464
-0.945
-17.47%
jan 1, 1996
1.993
-2.471
-55.35%
jan 1, 1997
-1.706
-3.699
-185.59%
jan 1, 1998
4.768
+6.474
-379.52%
jan 1, 1999
6.504
+1.736
36.4%
jan 1, 2000
-1.471
-7.975
-122.62%
jan 1, 2001
1.422
+2.893
-196.7%
jan 1, 2002
2.513
+1.09
76.64%
jan 1, 2003
1.147
-1.366
-54.37%
jan 1, 2004
0.116
-1.03
-89.87%
jan 1, 2005
3.023
+2.907
2.5K%
jan 1, 2006
2.352
-0.67
-22.18%
jan 1, 2007
5.38
+3.028
128.72%
jan 1, 2008
0.513
-4.868
-90.47%
jan 1, 2009
2.625
+2.113
412.24%
jan 1, 2010
-2.336
-4.961
-188.97%
jan 1, 2011
8.035
+10.37
-444.0%
jan 1, 2012
3.684
-4.351
-54.15%
jan 1, 2013
2.809
-0.875
-23.75%
jan 1, 2014
2.951
+0.143
5.08%
jan 1, 2015
0.959
-1.992
-67.51%
Ranking of countries by current statistics by years


Comments: