29
/it/
it
AIzaSyAYiBZKx7MnpbEhh9jyipgxe19OcubqV5w
April 1, 2024
108198
Comoros
COM
true
2
1
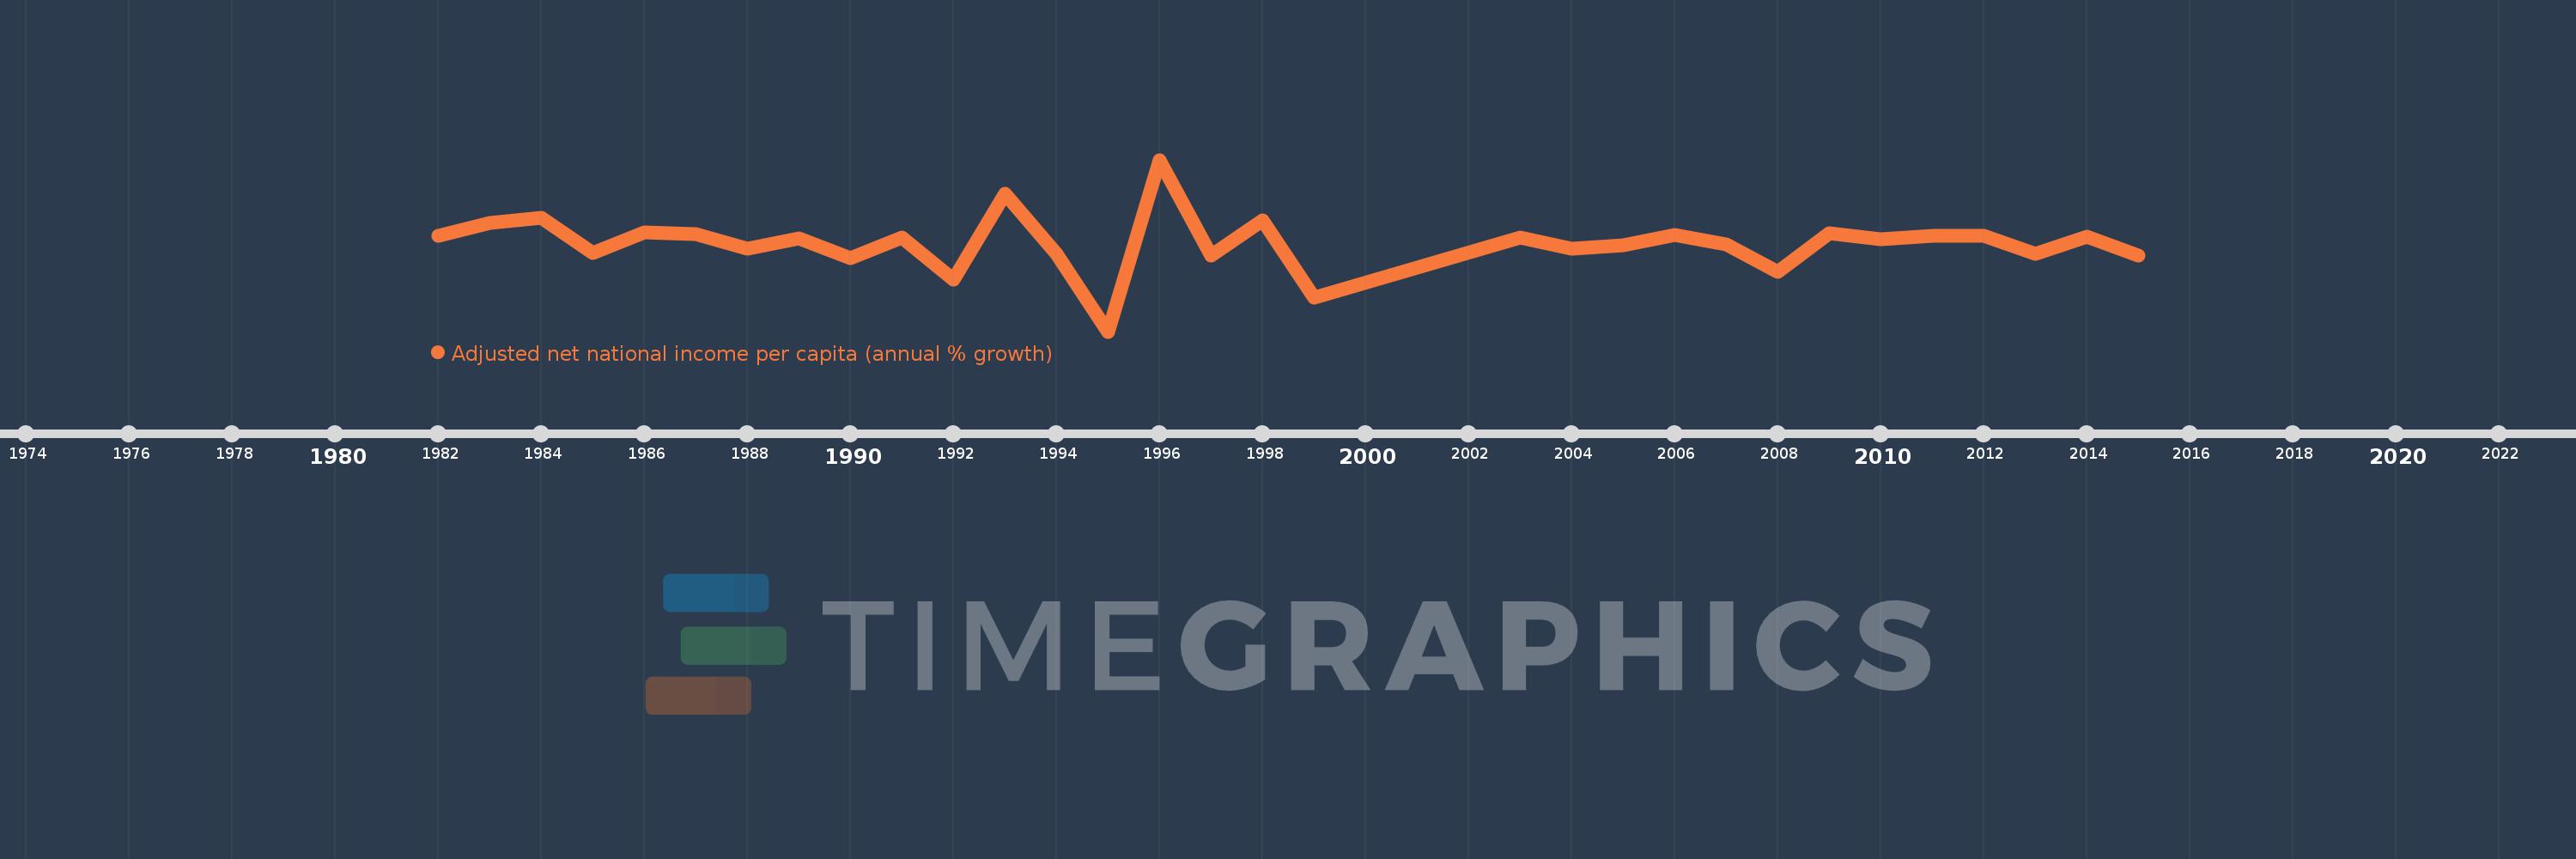
Adjusted net national income per capita (annual % growth)
2015,2014,2013,2012,2011,2010,2009,2008,2007,2006,2005,2004,2003,1999,1998,1997,1996,1995,1994,1993,1992,1991,1990,1989,1988,1987,1986,1985,1984,1983,1982
Queste statistiche in altri paesi:
Linea del tempo:
Questa scala temporale mostra un grafico dal 1982 anno al 2015 anno. Comoros. I dati fino ad 1981 anno non disponibili. Il numero di osservazioni attuali secondo i date: 31.
La fonte (nome):
Indicatori dello sviluppo mondiale
La fonte (organizzazione):
World Bank staff estimates based on sources and methods in World Bank's "The Changing Wealth of Nations: Measuring Sustainable Development in the New Millennium" (2011).
Categorie:
Economy & Growth
sono stati aggiornati
23 apr 2017 anni
Indicatori delle variazioni dei valori per anni
Minima:
-19.228
1 gen 1995 anni
Massimo:
15.734
1 gen 1996 anni
Alla data di osservazione
Valore
Variazione assoluta
La variazione rispetto al valore precedente
1 gen 1982 anni
0.327
+0.327
0.0%
1 gen 1983 anni
2.928
+2.601
794.64%
1 gen 1984 anni
3.978
+1.05
35.85%
1 gen 1985 anni
-3.191
-7.17
-180.22%
1 gen 1986 anni
0.975
+4.166
-130.54%
1 gen 1987 anni
0.563
-0.412
-42.24%
1 gen 1988 anni
-2.352
-2.915
-517.84%
1 gen 1989 anni
-0.209
+2.143
-91.11%
1 gen 1990 anni
-4.329
-4.12
1.97 Mille.%
1 gen 1991 anni
-0.087
+4.242
-97.99%
1 gen 1992 anni
-8.672
-8.585
9.87 Mille.%
1 gen 1993 anni
8.858
+17.53
-202.14%
1 gen 1994 anni
-3.49
-12.348
-139.4%
1 gen 1995 anni
-19.228
-15.738
450.98%
1 gen 1996 anni
15.734
+34.961
-181.83%
1 gen 1997 anni
-3.696
-19.43
-123.49%
1 gen 1998 anni
3.488
+7.184
-194.39%
1 gen 1999 anni
-12.385
-15.873
-455.01%
1 gen 2003 anni
-0.141
+12.243
-98.86%
1 gen 2004 anni
-2.284
-2.143
1.52 Mille.%
1 gen 2005 anni
-1.582
+0.702
-30.74%
1 gen 2006 anni
0.484
+2.066
-130.59%
1 gen 2007 anni
-1.521
-2.005
-414.33%
1 gen 2008 anni
-7.073
-5.551
364.88%
1 gen 2009 anni
0.72
+7.792
-110.17%
1 gen 2010 anni
-0.456
-1.175
-163.33%
1 gen 2011 anni
0.218
+0.673
-147.78%
1 gen 2012 anni
0.189
-0.028
-13.01%
1 gen 2013 anni
-3.44
-3.63
-1.92 Mille.%
1 gen 2014 anni
0.044
+3.484
-101.27%
1 gen 2015 anni
-3.75
-3.794
-8.71 Mille.%
Classificazione dei paesi secondo i statistiche attuali per anni


Commenti: