29
/it/
it
AIzaSyAYiBZKx7MnpbEhh9jyipgxe19OcubqV5w
April 1, 2024
90709
Brazil
BRA
true
2
1
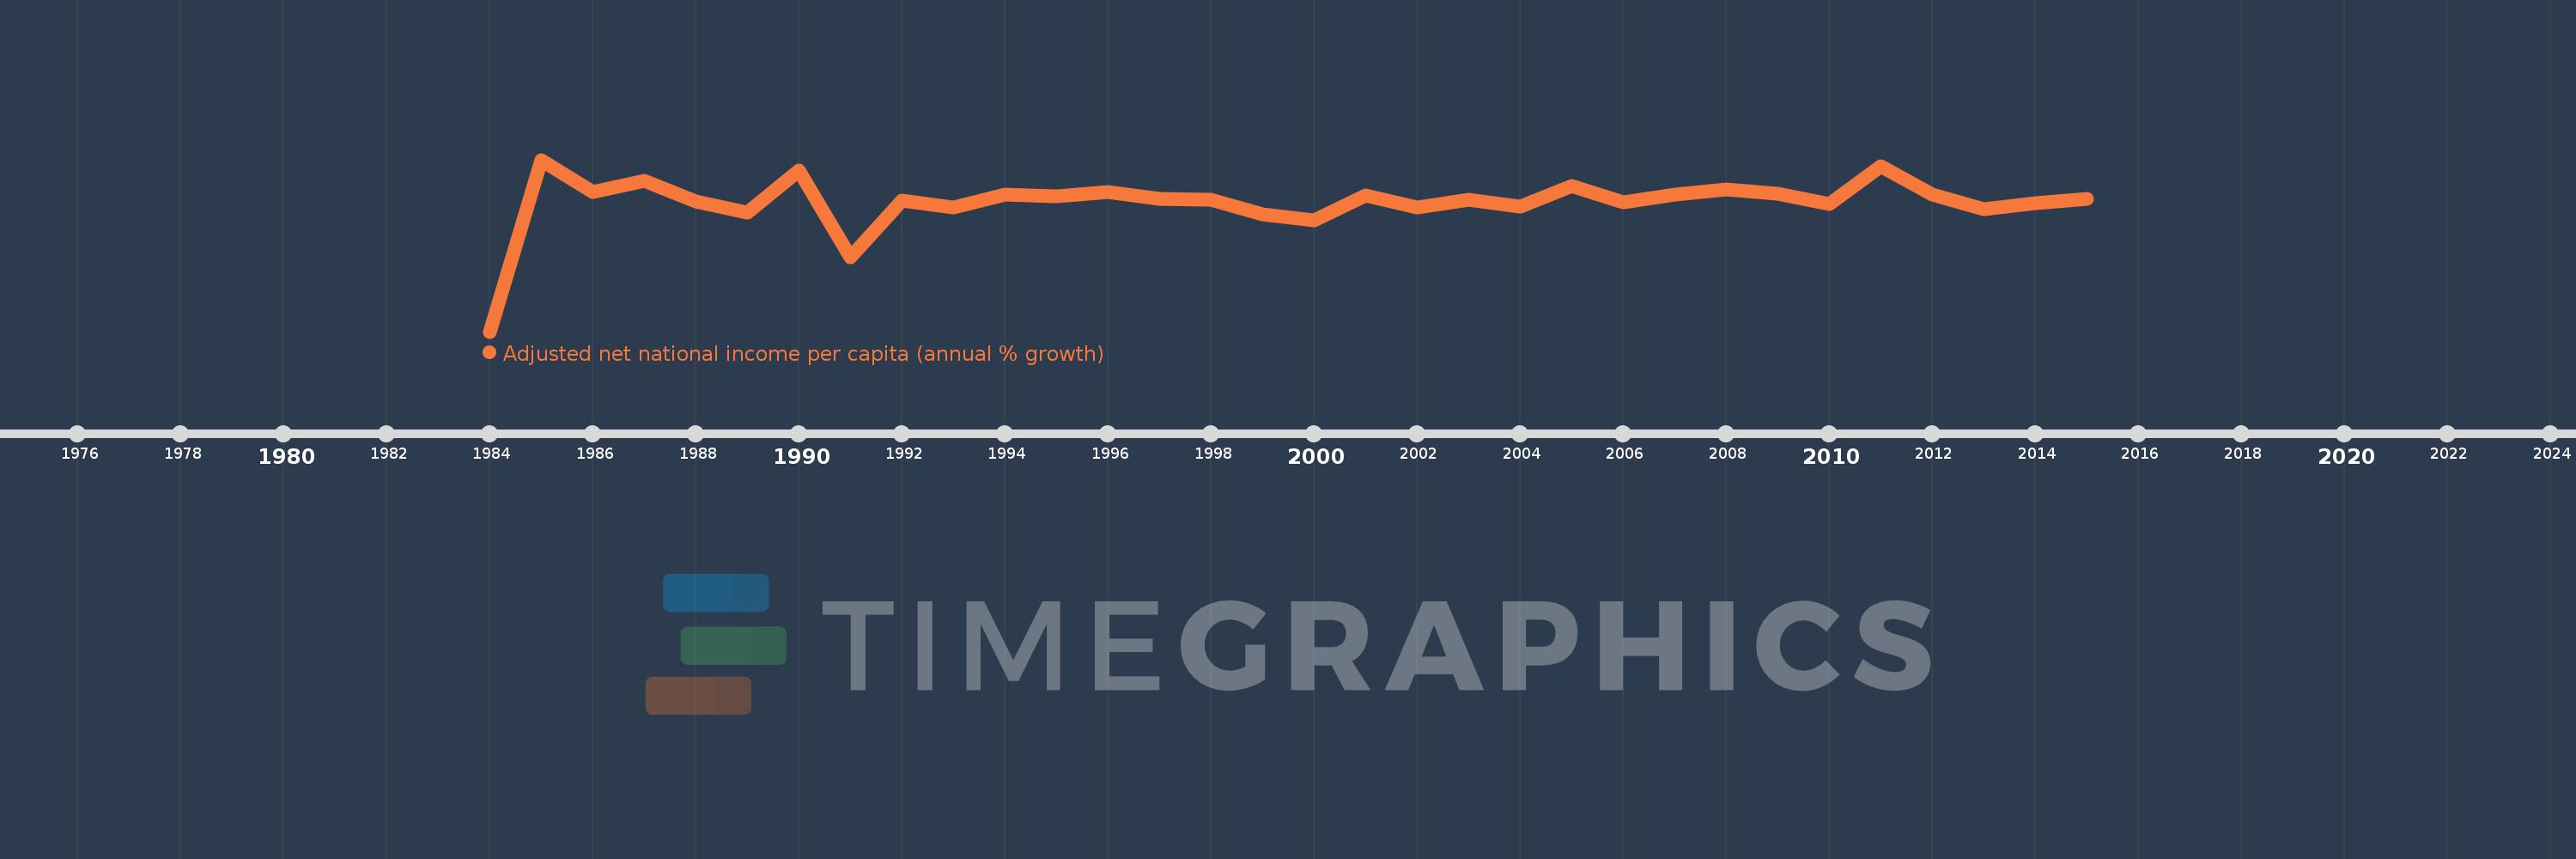
Adjusted net national income per capita (annual % growth)
2015,2014,2013,2012,2011,2010,2009,2008,2007,2006,2005,2004,2003,2002,2001,2000,1999,1998,1997,1996,1995,1994,1993,1992,1991,1990,1989,1988,1987,1986,1985,1984
Queste statistiche in altri paesi:
Linea del tempo:
Questa scala temporale mostra un grafico dal 1984 anno al 2015 anno. Brazil. I dati fino ad 1983 anno non disponibili. Il numero di osservazioni attuali secondo i date: 32.
La fonte (nome):
Indicatori dello sviluppo mondiale
La fonte (organizzazione):
World Bank staff estimates based on sources and methods in World Bank's "The Changing Wealth of Nations: Measuring Sustainable Development in the New Millennium" (2011).
Categorie:
Economy & Growth
sono stati aggiornati
23 apr 2017 anni
Indicatori delle variazioni dei valori per anni
Minima:
-42.923
1 gen 1984 anni
Massimo:
15.25
1 gen 1985 anni
Alla data di osservazione
Valore
Variazione assoluta
La variazione rispetto al valore precedente
1 gen 1984 anni
-42.923
-42.923
0.0%
1 gen 1985 anni
15.25
+58.173
-135.53%
1 gen 1986 anni
4.417
-10.833
-71.04%
1 gen 1987 anni
8.057
+3.64
82.41%
1 gen 1988 anni
1.224
-6.832
-84.8%
1 gen 1989 anni
-2.524
-3.748
-306.14%
1 gen 1990 anni
11.491
+14.015
-555.28%
1 gen 1991 anni
-17.883
-29.374
-255.62%
1 gen 1992 anni
1.556
+19.439
-108.7%
1 gen 1993 anni
-0.877
-2.433
-156.35%
1 gen 1994 anni
3.432
+4.309
-491.45%
1 gen 1995 anni
2.97
-0.462
-13.47%
1 gen 1996 anni
4.428
+1.459
49.11%
1 gen 1997 anni
2.009
-2.42
-54.64%
1 gen 1998 anni
1.751
-0.258
-12.83%
1 gen 1999 anni
-3.267
-5.018
-286.58%
1 gen 2000 anni
-5.367
-2.1
64.27%
1 gen 2001 anni
3.167
+8.533
-159.01%
1 gen 2002 anni
-0.82
-3.987
-125.89%
1 gen 2003 anni
1.803
+2.623
-319.94%
1 gen 2004 anni
-0.711
-2.514
-139.43%
1 gen 2005 anni
6.265
+6.976
-981.07%
1 gen 2006 anni
0.771
-5.495
-87.7%
1 gen 2007 anni
3.454
+2.684
348.2%
1 gen 2008 anni
5.167
+1.713
49.58%
1 gen 2009 anni
3.622
-1.545
-29.9%
1 gen 2010 anni
0.376
-3.246
-89.63%
1 gen 2011 anni
13.15
+12.774
3.4 Mille.%
1 gen 2012 anni
3.44
-9.709
-73.84%
1 gen 2013 anni
-1.495
-4.935
-143.44%
1 gen 2014 anni
0.546
+2.041
-136.54%
1 gen 2015 anni
1.94
+1.394
255.21%
Classificazione dei paesi secondo i statistiche attuali per anni


Commenti: