29
/it/
it
AIzaSyAYiBZKx7MnpbEhh9jyipgxe19OcubqV5w
April 1, 2024
93181
Bulgaria
BGR
true
2
1
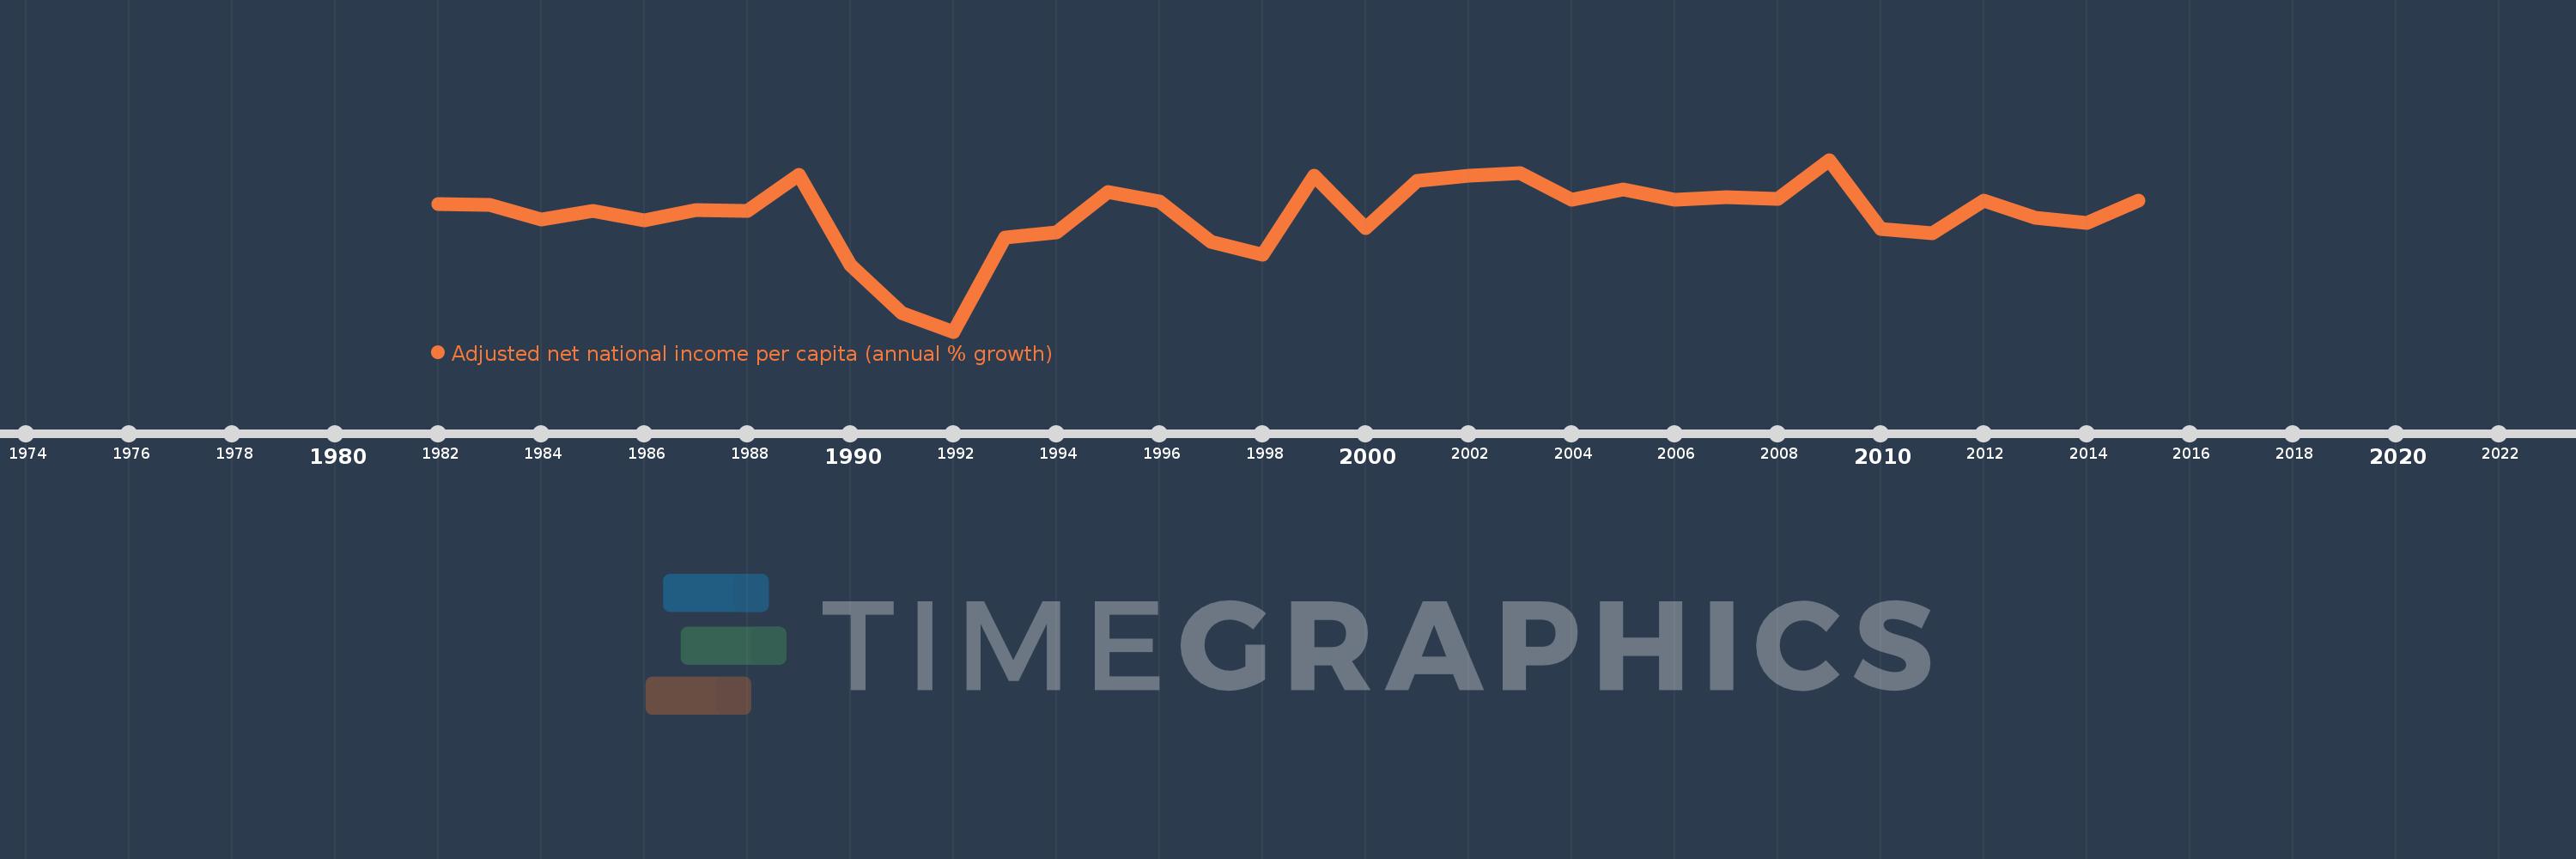
Adjusted net national income per capita (annual % growth)
2015,2014,2013,2012,2011,2010,2009,2008,2007,2006,2005,2004,2003,2002,2001,2000,1999,1998,1997,1996,1995,1994,1993,1992,1991,1990,1989,1988,1987,1986,1985,1984,1983,1982
Queste statistiche in altri paesi:
Linea del tempo:
Questa scala temporale mostra un grafico dal 1982 anno al 2015 anno. Bulgaria. I dati fino ad 1981 anno non disponibili. Il numero di osservazioni attuali secondo i date: 34.
La fonte (nome):
Indicatori dello sviluppo mondiale
La fonte (organizzazione):
World Bank staff estimates based on sources and methods in World Bank's "The Changing Wealth of Nations: Measuring Sustainable Development in the New Millennium" (2011).
Categorie:
Economy & Growth
sono stati aggiornati
23 apr 2017 anni
Indicatori delle variazioni dei valori per anni
Minima:
-19.568
1 gen 1992 anni
Massimo:
12.327
1 gen 2009 anni
Alla data di osservazione
Valore
Variazione assoluta
La variazione rispetto al valore precedente
1 gen 1982 anni
4.089
+4.089
0.0%
1 gen 1983 anni
3.947
-0.142
-3.47%
1 gen 1984 anni
1.224
-2.723
-68.98%
1 gen 1985 anni
2.858
+1.634
133.44%
1 gen 1986 anni
1.153
-1.706
-59.68%
1 gen 1987 anni
2.919
+1.766
153.23%
1 gen 1988 anni
2.824
-0.094
-3.23%
1 gen 1989 anni
9.592
+6.768
239.62%
1 gen 1990 anni
-7.153
-16.745
-174.57%
1 gen 1991 anni
-16.184
-9.031
126.26%
1 gen 1992 anni
-19.568
-3.385
20.91%
1 gen 1993 anni
-2.026
+17.543
-89.65%
1 gen 1994 anni
-1.133
+0.892
-44.05%
1 gen 1995 anni
6.352
+7.486
-660.5%
1 gen 1996 anni
4.533
-1.819
-28.64%
1 gen 1997 anni
-2.873
-7.407
-163.38%
1 gen 1998 anni
-5.25
-2.377
82.71%
1 gen 1999 anni
9.34
+14.59
-277.91%
1 gen 2000 anni
-0.421
-9.761
-104.51%
1 gen 2001 anni
8.474
+8.895
-2.11 Mille.%
1 gen 2002 anni
9.355
+0.881
10.4%
1 gen 2003 anni
9.851
+0.496
5.3%
1 gen 2004 anni
4.973
-4.878
-49.52%
1 gen 2005 anni
6.873
+1.9
38.21%
1 gen 2006 anni
4.976
-1.897
-27.6%
1 gen 2007 anni
5.331
+0.355
7.13%
1 gen 2008 anni
5.089
-0.242
-4.54%
1 gen 2009 anni
12.327
+7.238
142.23%
1 gen 2010 anni
-0.46
-12.787
-103.73%
1 gen 2011 anni
-1.289
-0.829
180.19%
1 gen 2012 anni
4.766
+6.055
-469.82%
1 gen 2013 anni
1.618
-3.148
-66.05%
1 gen 2014 anni
0.652
-0.966
-59.73%
1 gen 2015 anni
4.778
+4.126
633.26%
Classificazione dei paesi secondo i statistiche attuali per anni


Commenti: