29
/it/
it
AIzaSyAYiBZKx7MnpbEhh9jyipgxe19OcubqV5w
April 1, 2024
154172
India
IND
true
2
1
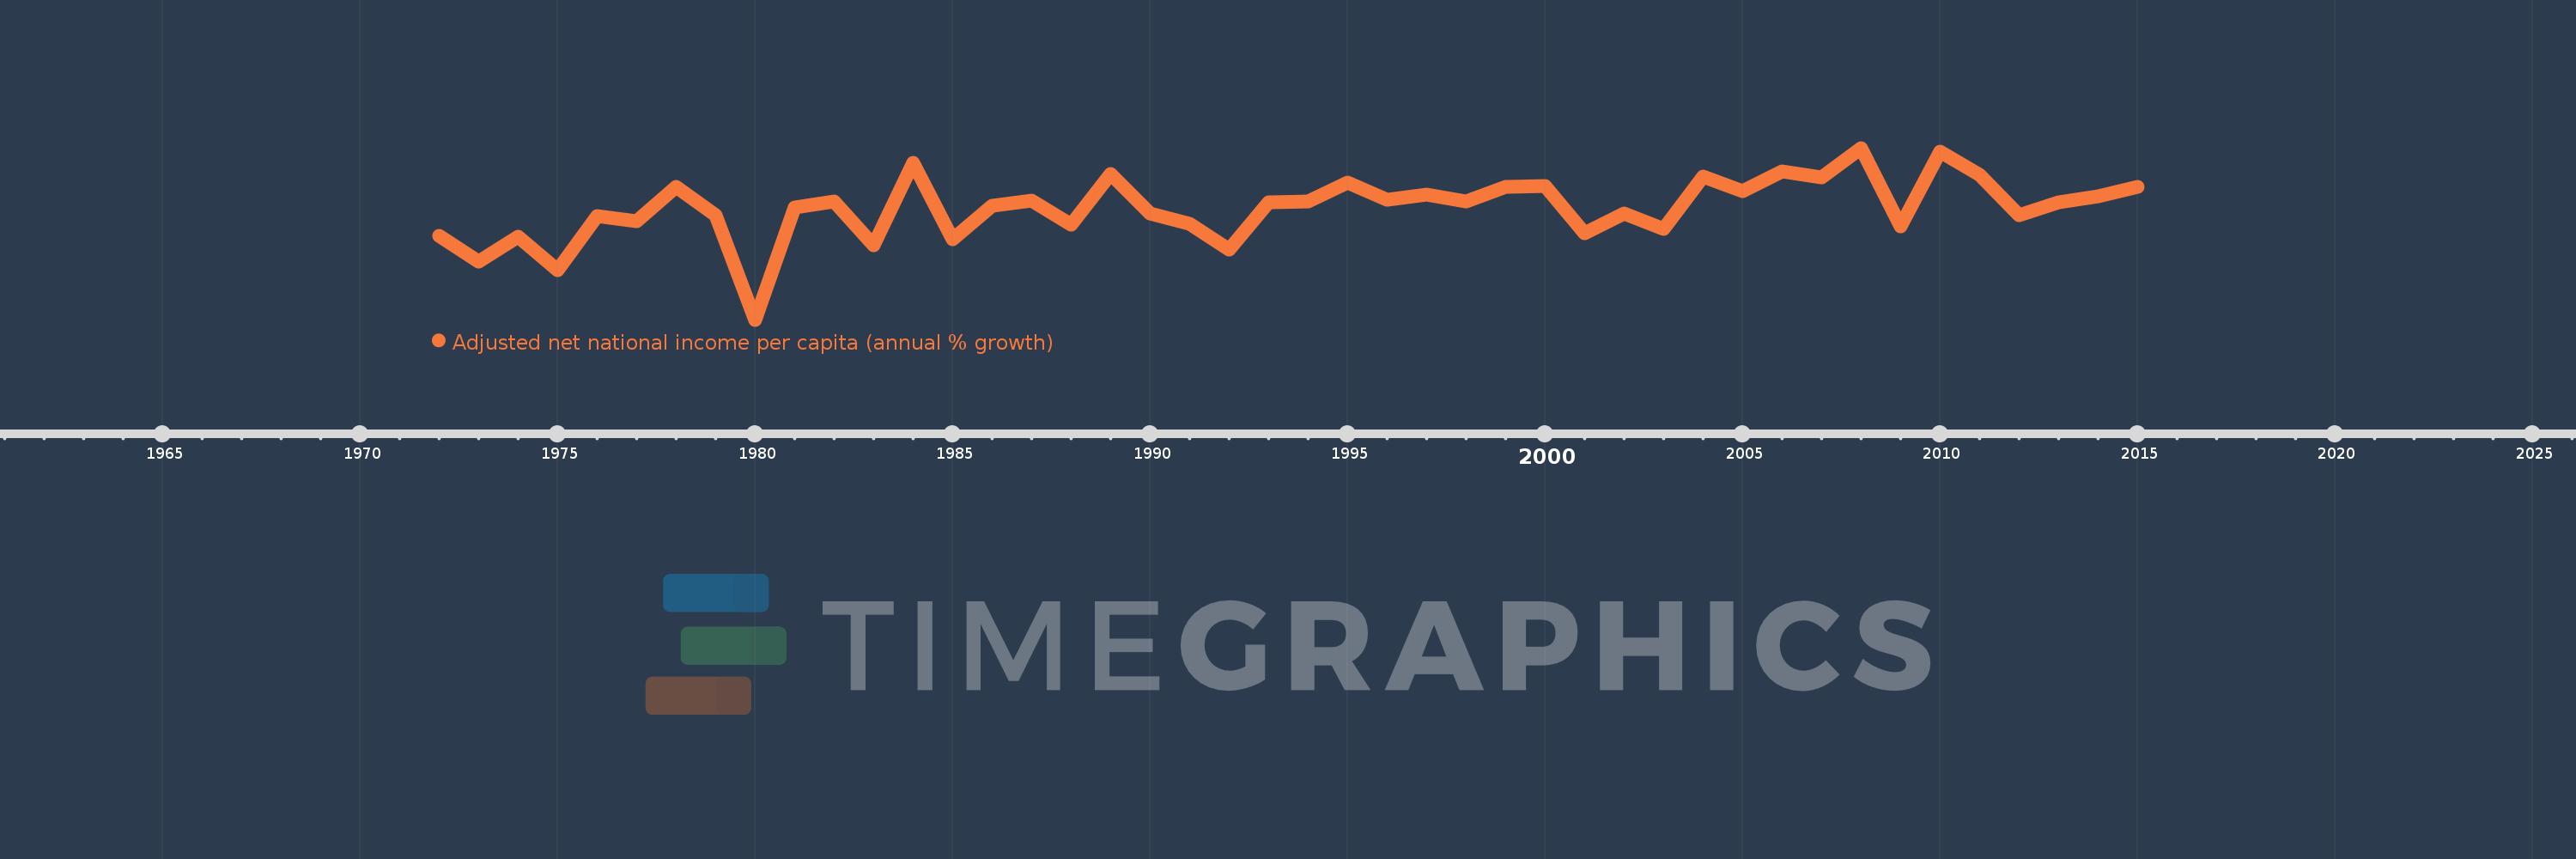
Adjusted net national income per capita (annual % growth)
2015,2014,2013,2012,2011,2010,2009,2008,2007,2006,2005,2004,2003,2002,2001,2000,1999,1998,1997,1996,1995,1994,1993,1992,1991,1990,1989,1988,1987,1986,1985,1984,1983,1982,1981,1980,1979,1978,1977,1976,1975,1974,1973,1972
Queste statistiche in altri paesi:
Linea del tempo:
Questa scala temporale mostra un grafico dal 1972 anno al 2015 anno. India. I dati fino ad 1971 anno non disponibili. Il numero di osservazioni attuali secondo i date: 44.
La fonte (nome):
Indicatori dello sviluppo mondiale
La fonte (organizzazione):
World Bank staff estimates based on sources and methods in World Bank's "The Changing Wealth of Nations: Measuring Sustainable Development in the New Millennium" (2011).
Categorie:
Economy & Growth
sono stati aggiornati
23 apr 2017 anni
Indicatori delle variazioni dei valori per anni
Minima:
-9.444
1 gen 1980 anni
Massimo:
10.228
1 gen 2008 anni
Alla data di osservazione
Valore
Variazione assoluta
La variazione rispetto al valore precedente
1 gen 1972 anni
0.122
+0.122
0.0%
1 gen 1973 anni
-2.772
-2.894
-2.37 Mille.%
1 gen 1974 anni
0.07
+2.842
-102.51%
1 gen 1975 anni
-3.754
-3.823
-5.49 Mille.%
1 gen 1976 anni
2.469
+6.223
-165.77%
1 gen 1977 anni
1.798
-0.671
-27.18%
1 gen 1978 anni
5.779
+3.981
221.41%
1 gen 1979 anni
2.529
-3.25
-56.24%
1 gen 1980 anni
-9.444
-11.973
-473.45%
1 gen 1981 anni
3.451
+12.895
-136.54%
1 gen 1982 anni
4.145
+0.694
20.12%
1 gen 1983 anni
-0.916
-5.061
-122.1%
1 gen 1984 anni
8.487
+9.402
-1.03 Mille.%
1 gen 1985 anni
-0.204
-8.691
-102.41%
1 gen 1986 anni
3.641
+3.845
-1.88 Mille.%
1 gen 1987 anni
4.217
+0.576
15.81%
1 gen 1988 anni
1.487
-2.729
-64.73%
1 gen 1989 anni
7.23
+5.743
386.09%
1 gen 1990 anni
2.733
-4.498
-62.21%
1 gen 1991 anni
1.572
-1.16
-42.46%
1 gen 1992 anni
-1.441
-3.013
-191.62%
1 gen 1993 anni
4.045
+5.485
-380.75%
1 gen 1994 anni
4.12
+0.076
1.87%
1 gen 1995 anni
6.236
+2.115
51.34%
1 gen 1996 anni
4.315
-1.921
-30.81%
1 gen 1997 anni
4.845
+0.531
12.3%
1 gen 1998 anni
4.111
-0.735
-15.16%
1 gen 1999 anni
5.74
+1.629
39.64%
1 gen 2000 anni
5.911
+0.171
2.98%
1 gen 2001 anni
0.448
-5.463
-92.43%
1 gen 2002 anni
2.748
+2.3
513.84%
1 gen 2003 anni
0.997
-1.751
-63.73%
1 gen 2004 anni
6.939
+5.943
596.3%
1 gen 2005 anni
5.309
-1.63
-23.49%
1 gen 2006 anni
7.523
+2.214
41.7%
1 gen 2007 anni
6.898
-0.625
-8.3%
1 gen 2008 anni
10.228
+3.33
48.27%
1 gen 2009 anni
1.201
-9.027
-88.26%
1 gen 2010 anni
9.794
+8.592
715.34%
1 gen 2011 anni
7.146
-2.647
-27.03%
1 gen 2012 anni
2.483
-4.663
-65.25%
1 gen 2013 anni
3.999
+1.516
61.03%
1 gen 2014 anni
4.681
+0.682
17.05%
1 gen 2015 anni
5.799
+1.118
23.9%
Classificazione dei paesi secondo i statistiche attuali per anni


Commenti: