29
/it/
it
AIzaSyAYiBZKx7MnpbEhh9jyipgxe19OcubqV5w
April 1, 2024
94438
Burkina Faso
BFA
true
2
1
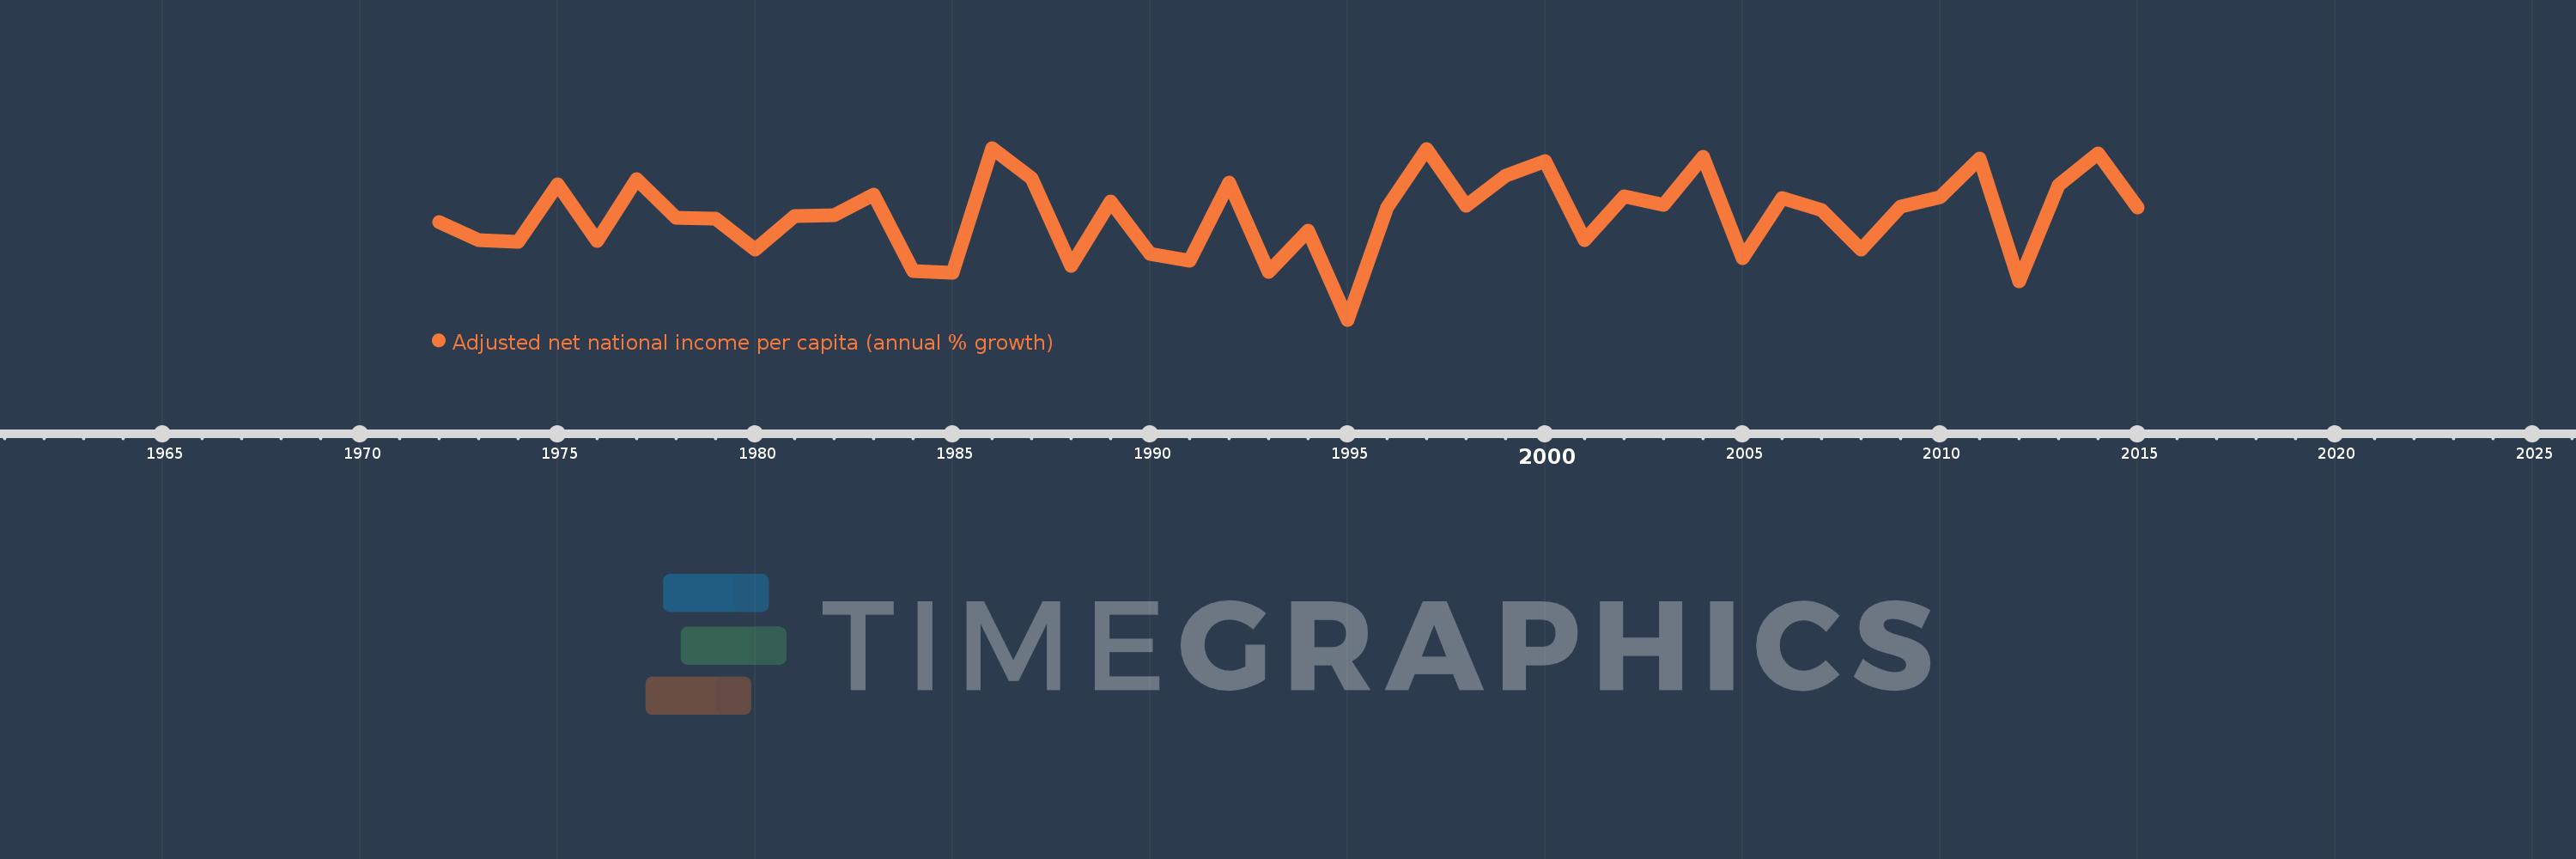
Adjusted net national income per capita (annual % growth)
2015,2014,2013,2012,2011,2010,2009,2008,2007,2006,2005,2004,2003,2002,2001,2000,1999,1998,1997,1996,1995,1994,1993,1992,1991,1990,1989,1988,1987,1986,1985,1984,1983,1982,1981,1980,1979,1978,1977,1976,1975,1974,1973,1972
Queste statistiche in altri paesi:
Linea del tempo:
Questa scala temporale mostra un grafico dal 1972 anno al 2015 anno. Burkina Faso. I dati fino ad 1971 anno non disponibili. Il numero di osservazioni attuali secondo i date: 44.
La fonte (nome):
Indicatori dello sviluppo mondiale
La fonte (organizzazione):
World Bank staff estimates based on sources and methods in World Bank's "The Changing Wealth of Nations: Measuring Sustainable Development in the New Millennium" (2011).
Categorie:
Economy & Growth
sono stati aggiornati
23 apr 2017 anni
Indicatori delle variazioni dei valori per anni
Minima:
-8.895
1 gen 1995 anni
Massimo:
8.461
1 gen 1986 anni
Alla data di osservazione
Valore
Variazione assoluta
La variazione rispetto al valore precedente
1 gen 1972 anni
0.99
+0.99
0.0%
1 gen 1973 anni
-0.842
-1.832
-185.04%
1 gen 1974 anni
-1.06
-0.218
25.9%
1 gen 1975 anni
4.764
+5.824
-549.56%
1 gen 1976 anni
-0.952
-5.716
-119.97%
1 gen 1977 anni
5.335
+6.287
-660.71%
1 gen 1978 anni
1.426
-3.909
-73.27%
1 gen 1979 anni
1.324
-0.102
-7.16%
1 gen 1980 anni
-1.797
-3.121
-235.7%
1 gen 1981 anni
1.539
+3.336
-185.64%
1 gen 1982 anni
1.623
+0.084
5.49%
1 gen 1983 anni
3.738
+2.114
130.23%
1 gen 1984 anni
-3.992
-7.729
-206.79%
1 gen 1985 anni
-4.123
-0.131
3.28%
1 gen 1986 anni
8.461
+12.584
-305.25%
1 gen 1987 anni
5.433
-3.028
-35.79%
1 gen 1988 anni
-3.43
-8.864
-163.14%
1 gen 1989 anni
3.086
+6.516
-189.95%
1 gen 1990 anni
-2.256
-5.342
-173.11%
1 gen 1991 anni
-2.964
-0.708
31.4%
1 gen 1992 anni
5.0
+7.964
-268.67%
1 gen 1993 anni
-4.043
-9.043
-180.87%
1 gen 1994 anni
0.12
+4.163
-102.96%
1 gen 1995 anni
-8.895
-9.015
-7.53 Mille.%
1 gen 1996 anni
2.456
+11.351
-127.61%
1 gen 1997 anni
8.321
+5.865
238.79%
1 gen 1998 anni
2.633
-5.689
-68.36%
1 gen 1999 anni
5.674
+3.041
115.5%
1 gen 2000 anni
7.148
+1.475
25.99%
1 gen 2001 anni
-0.833
-7.982
-111.66%
1 gen 2002 anni
3.59
+4.423
-530.75%
1 gen 2003 anni
2.7
-0.89
-24.8%
1 gen 2004 anni
7.525
+4.826
178.77%
1 gen 2005 anni
-2.663
-10.188
-135.38%
1 gen 2006 anni
3.375
+6.038
-226.75%
1 gen 2007 anni
2.211
-1.164
-34.48%
1 gen 2008 anni
-1.815
-4.026
-182.06%
1 gen 2009 anni
2.556
+4.371
-240.87%
1 gen 2010 anni
3.451
+0.894
34.99%
1 gen 2011 anni
7.383
+3.933
113.96%
1 gen 2012 anni
-5.025
-12.408
-168.06%
1 gen 2013 anni
4.683
+9.708
-193.21%
1 gen 2014 anni
7.933
+3.249
69.37%
1 gen 2015 anni
2.426
-5.507
-69.42%
Classificazione dei paesi secondo i statistiche attuali per anni


Commenti: