29
/it/
it
AIzaSyAYiBZKx7MnpbEhh9jyipgxe19OcubqV5w
April 1, 2024
212550
Nigeria
NGA
true
2
1
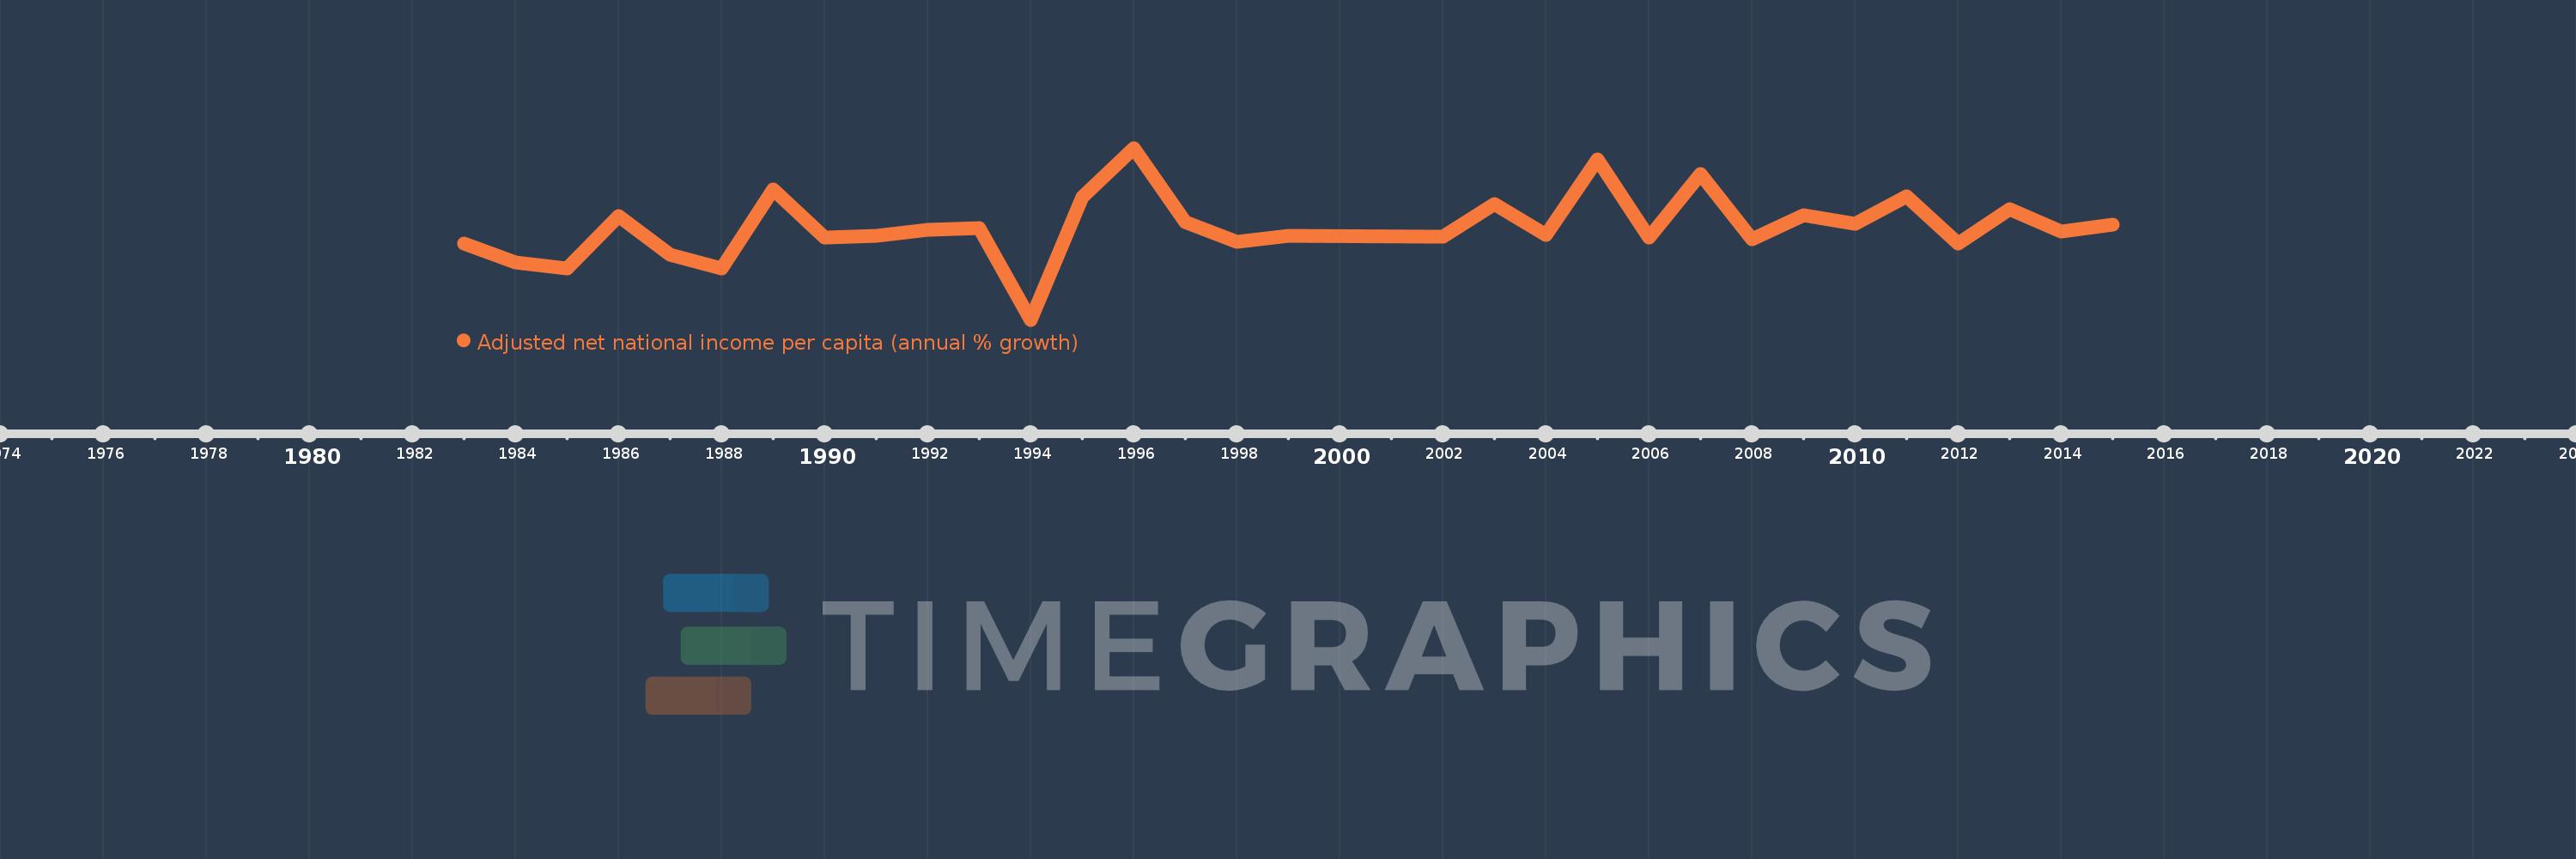
Adjusted net national income per capita (annual % growth)
2015,2014,2013,2012,2011,2010,2009,2008,2007,2006,2005,2004,2003,2002,1999,1998,1997,1996,1995,1994,1993,1992,1991,1990,1989,1988,1987,1986,1985,1984,1983
Queste statistiche in altri paesi:
Linea del tempo:
Questa scala temporale mostra un grafico dal 1983 anno al 2015 anno. Nigeria. I dati fino ad 1982 anno non disponibili. Il numero di osservazioni attuali secondo i date: 31.
La fonte (nome):
Indicatori dello sviluppo mondiale
La fonte (organizzazione):
World Bank staff estimates based on sources and methods in World Bank's "The Changing Wealth of Nations: Measuring Sustainable Development in the New Millennium" (2011).
Categorie:
Economy & Growth
sono stati aggiornati
23 apr 2017 anni
Indicatori delle variazioni dei valori per anni
Minima:
-43.731
1 gen 1994 anni
Massimo:
40.918
1 gen 1996 anni
Alla data di osservazione
Valore
Variazione assoluta
La variazione rispetto al valore precedente
1 gen 1983 anni
-6.373
-6.373
0.0%
1 gen 1984 anni
-15.517
-9.143
143.46%
1 gen 1985 anni
-18.33
-2.814
18.14%
1 gen 1986 anni
7.479
+25.809
-140.8%
1 gen 1987 anni
-11.886
-19.365
-258.93%
1 gen 1988 anni
-18.305
-6.419
54.01%
1 gen 1989 anni
20.429
+38.734
-211.6%
1 gen 1990 anni
-3.307
-23.735
-116.19%
1 gen 1991 anni
-2.426
+0.881
-26.63%
1 gen 1992 anni
0.748
+3.174
-130.81%
1 gen 1993 anni
1.334
+0.587
78.48%
1 gen 1994 anni
-43.731
-45.065
-3.38 Mille.%
1 gen 1995 anni
16.563
+60.294
-137.88%
1 gen 1996 anni
40.918
+24.354
147.04%
1 gen 1997 anni
4.436
-36.481
-89.16%
1 gen 1998 anni
-5.482
-9.918
-223.56%
1 gen 1999 anni
-2.539
+2.943
-53.69%
1 gen 2002 anni
-2.707
-0.168
6.63%
1 gen 2003 anni
13.454
+16.161
-597.02%
1 gen 2004 anni
-2.019
-15.474
-115.01%
1 gen 2005 anni
35.492
+37.511
-1.86 Mille.%
1 gen 2006 anni
-3.257
-38.748
-109.18%
1 gen 2007 anni
27.941
+31.198
-958.0%
1 gen 2008 anni
-4.055
-31.996
-114.51%
1 gen 2009 anni
7.577
+11.631
-286.87%
1 gen 2010 anni
3.646
-3.93
-51.88%
1 gen 2011 anni
17.056
+13.41
367.78%
1 gen 2012 anni
-6.108
-23.164
-135.81%
1 gen 2013 anni
10.667
+16.775
-274.64%
1 gen 2014 anni
-0.105
-10.772
-100.98%
1 gen 2015 anni
3.214
+3.319
-3.17 Mille.%
Classificazione dei paesi secondo i statistiche attuali per anni


Commenti: