29
/it/
it
AIzaSyAYiBZKx7MnpbEhh9jyipgxe19OcubqV5w
April 1, 2024
42057
Latin America & Caribbean (excluding high income)
LAC
false
2
1
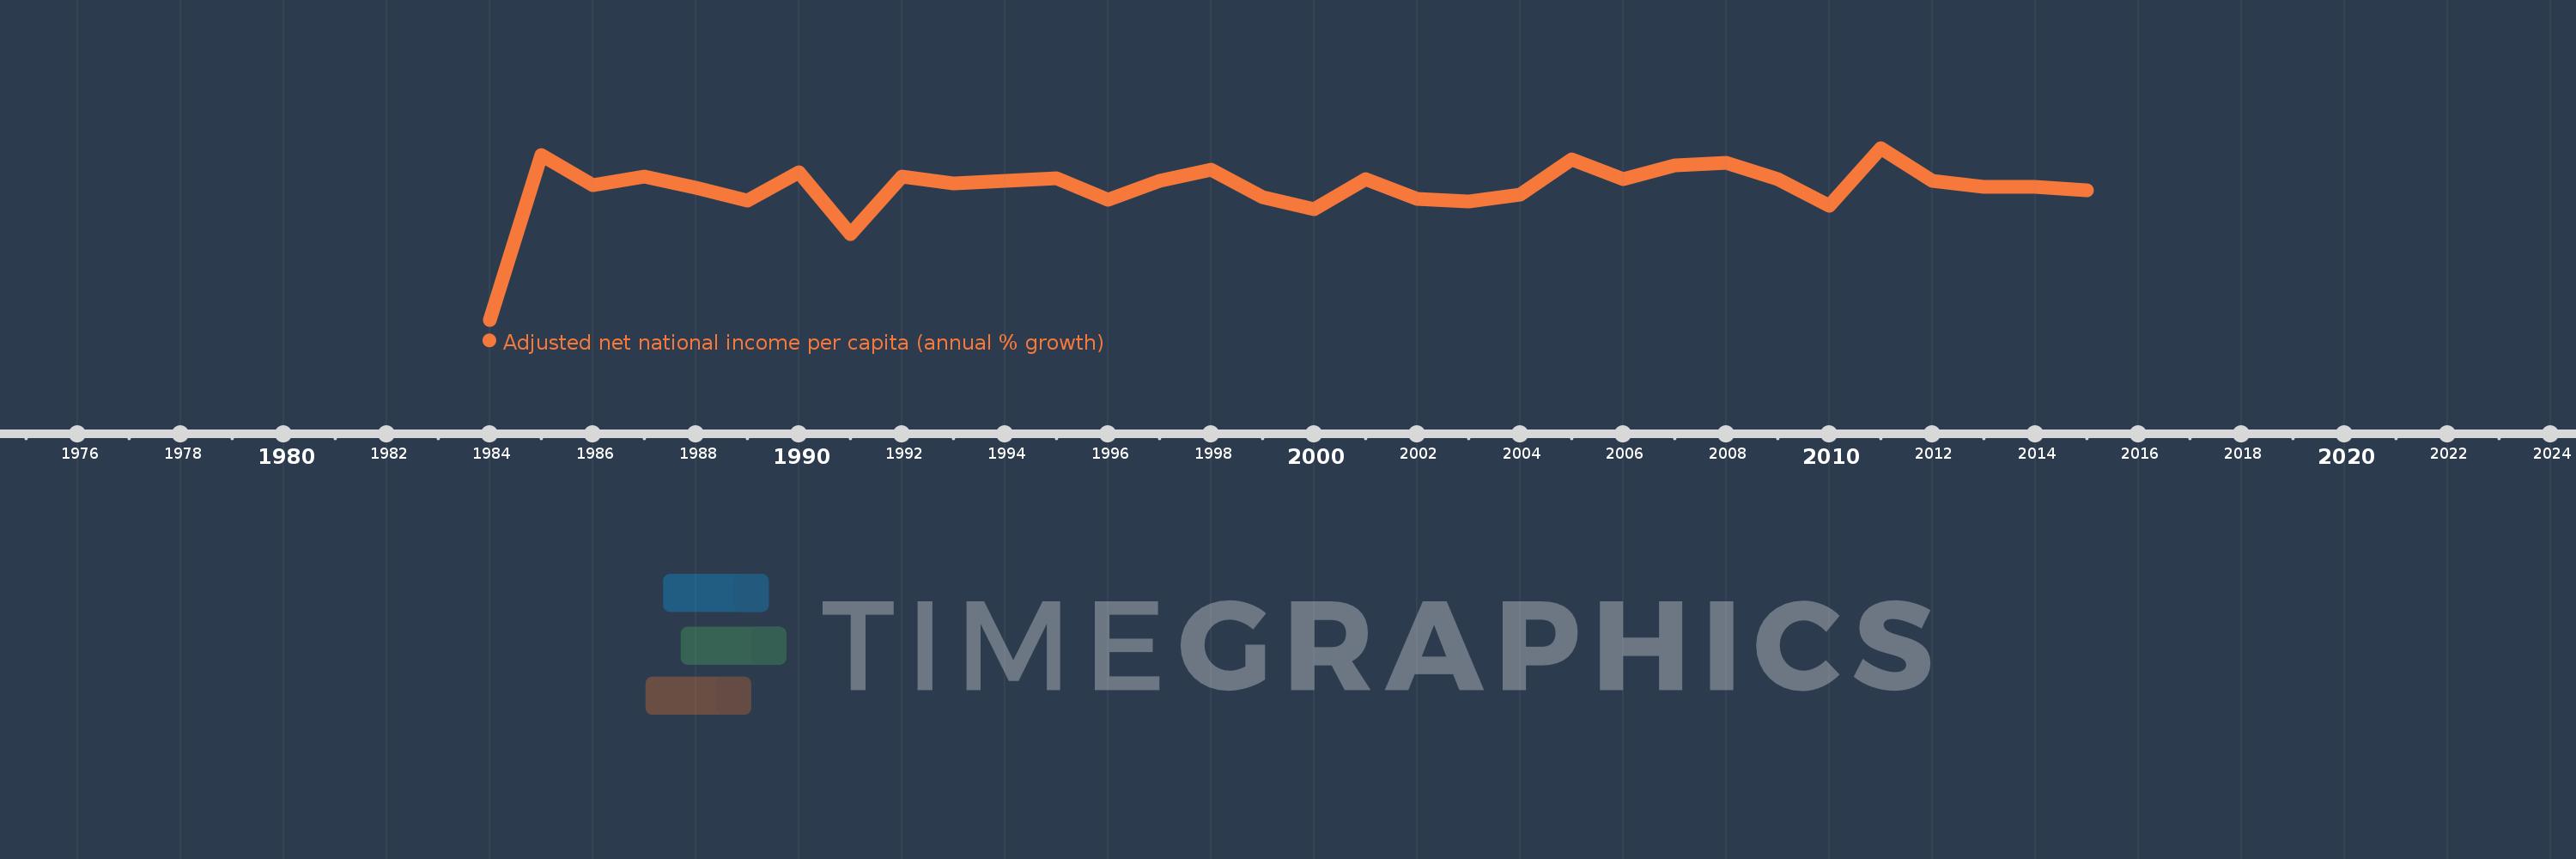
Adjusted net national income per capita (annual % growth)
2015,2014,2013,2012,2011,2010,2009,2008,2007,2006,2005,2004,2003,2002,2001,2000,1999,1998,1997,1996,1995,1994,1993,1992,1991,1990,1989,1988,1987,1986,1985,1984
Queste statistiche in altri paesi:
Linea del tempo:
Questa scala temporale mostra un grafico dal 1984 anno al 2015 anno. Latin America & Caribbean (excluding high income). I dati fino ad 1983 anno non disponibili. Il numero di osservazioni attuali secondo i date: 32.
La fonte (nome):
Indicatori dello sviluppo mondiale
La fonte (organizzazione):
World Bank staff estimates based on sources and methods in World Bank's "The Changing Wealth of Nations: Measuring Sustainable Development in the New Millennium" (2011).
Categorie:
Economy & Growth
sono stati aggiornati
23 apr 2017 anni
Indicatori delle variazioni dei valori per anni
Minima:
-25.501
1 gen 1984 anni
Massimo:
9.046
1 gen 2011 anni
Alla data di osservazione
Valore
Variazione assoluta
La variazione rispetto al valore precedente
1 gen 1984 anni
-25.501
-25.501
0.0%
1 gen 1985 anni
7.663
+33.164
-130.05%
1 gen 1986 anni
1.563
-6.1
-79.61%
1 gen 1987 anni
3.351
+1.788
114.43%
1 gen 1988 anni
1.024
-2.327
-69.44%
1 gen 1989 anni
-1.605
-2.63
-256.75%
1 gen 1990 anni
4.155
+5.76
-358.78%
1 gen 1991 anni
-8.221
-12.376
-297.87%
1 gen 1992 anni
3.225
+11.446
-139.23%
1 gen 1993 anni
1.878
-1.348
-41.78%
1 gen 1994 anni
2.431
+0.553
29.46%
1 gen 1995 anni
3.032
+0.601
24.72%
1 gen 1996 anni
-1.361
-4.393
-144.9%
1 gen 1997 anni
2.353
+3.714
-272.84%
1 gen 1998 anni
4.75
+2.397
101.89%
1 gen 1999 anni
-0.779
-5.529
-116.4%
1 gen 2000 anni
-3.2
-2.421
310.8%
1 gen 2001 anni
2.767
+5.967
-186.48%
1 gen 2002 anni
-1.133
-3.9
-140.95%
1 gen 2003 anni
-1.733
-0.6
52.93%
1 gen 2004 anni
-0.293
+1.44
-83.1%
1 gen 2005 anni
6.738
+7.031
-2.4 Mille.%
1 gen 2006 anni
2.84
-3.898
-57.85%
1 gen 2007 anni
5.526
+2.686
94.56%
1 gen 2008 anni
6.13
+0.604
10.92%
1 gen 2009 anni
2.811
-3.319
-54.14%
1 gen 2010 anni
-2.655
-5.466
-194.44%
1 gen 2011 anni
9.046
+11.701
-440.75%
1 gen 2012 anni
2.366
-6.68
-73.85%
1 gen 2013 anni
1.189
-1.177
-49.74%
1 gen 2014 anni
1.15
-0.039
-3.31%
1 gen 2015 anni
0.569
-0.58
-50.48%
Classificazione dei paesi secondo i statistiche attuali per anni


Commenti: