29
/it/
it
AIzaSyAYiBZKx7MnpbEhh9jyipgxe19OcubqV5w
April 1, 2024
256991
Switzerland
CHE
true
2
1
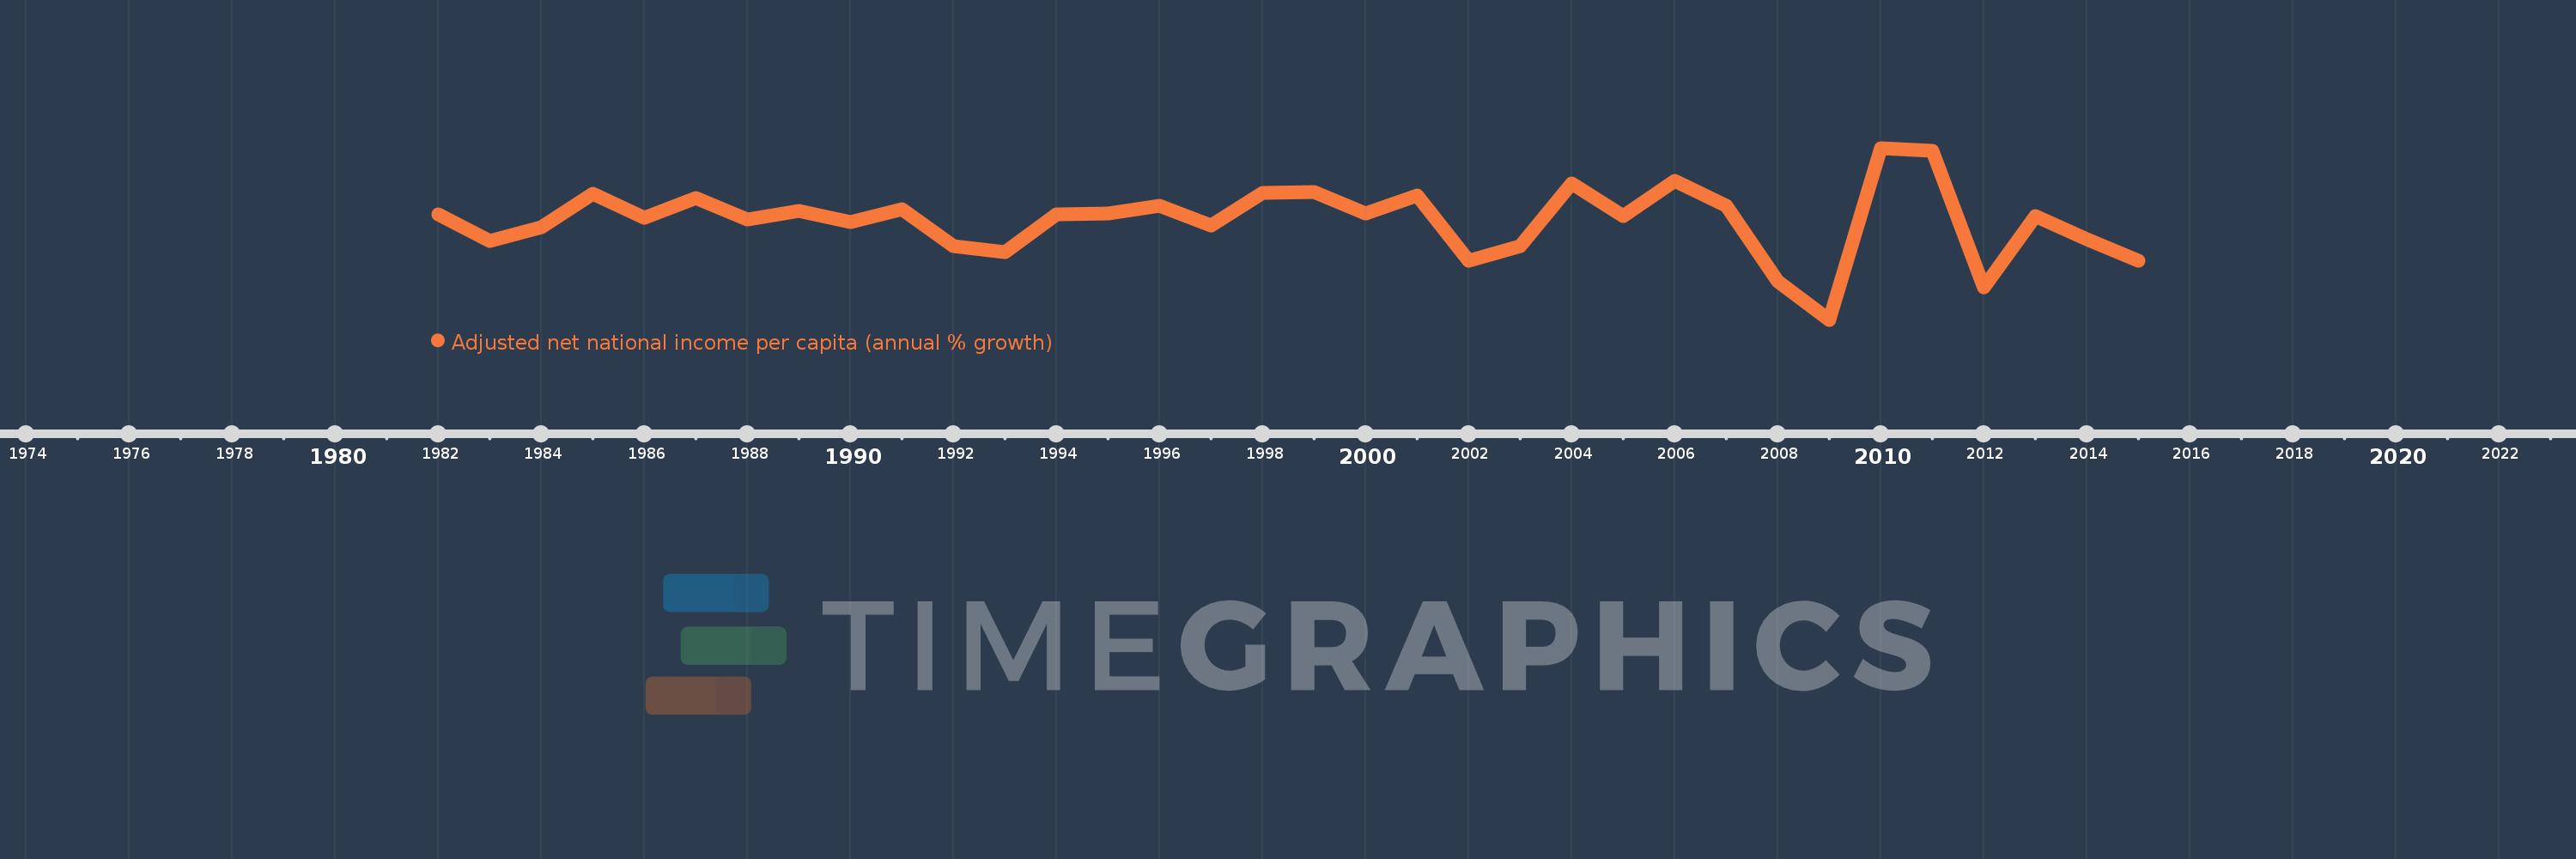
Adjusted net national income per capita (annual % growth)
2015,2014,2013,2012,2011,2010,2009,2008,2007,2006,2005,2004,2003,2002,2001,2000,1999,1998,1997,1996,1995,1994,1993,1992,1991,1990,1989,1988,1987,1986,1985,1984,1983,1982
Queste statistiche in altri paesi:
Linea del tempo:
Questa scala temporale mostra un grafico dal 1982 anno al 2015 anno. Switzerland. I dati fino ad 1981 anno non disponibili. Il numero di osservazioni attuali secondo i date: 34.
La fonte (nome):
Indicatori dello sviluppo mondiale
La fonte (organizzazione):
World Bank staff estimates based on sources and methods in World Bank's "The Changing Wealth of Nations: Measuring Sustainable Development in the New Millennium" (2011).
Categorie:
Economy & Growth
sono stati aggiornati
23 apr 2017 anni
Indicatori delle variazioni dei valori per anni
Minima:
-8.773
1 gen 2009 anni
Massimo:
8.061
1 gen 2010 anni
Alla data di osservazione
Valore
Variazione assoluta
La variazione rispetto al valore precedente
1 gen 1982 anni
1.569
+1.569
0.0%
1 gen 1983 anni
-1.044
-2.613
-166.55%
1 gen 1984 anni
0.334
+1.378
-131.98%
1 gen 1985 anni
3.552
+3.218
963.65%
1 gen 1986 anni
1.259
-2.293
-64.56%
1 gen 1987 anni
3.17
+1.911
151.82%
1 gen 1988 anni
1.06
-2.111
-66.58%
1 gen 1989 anni
1.867
+0.807
76.18%
1 gen 1990 anni
0.771
-1.096
-58.72%
1 gen 1991 anni
2.032
+1.262
163.71%
1 gen 1992 anni
-1.563
-3.595
-176.91%
1 gen 1993 anni
-2.14
-0.577
36.9%
1 gen 1994 anni
1.584
+3.724
-174.03%
1 gen 1995 anni
1.6
+0.016
1.01%
1 gen 1996 anni
2.382
+0.782
48.9%
1 gen 1997 anni
0.446
-1.936
-81.26%
1 gen 1998 anni
3.657
+3.21
719.24%
1 gen 1999 anni
3.768
+0.112
3.05%
1 gen 2000 anni
1.64
-2.128
-56.47%
1 gen 2001 anni
3.402
+1.761
107.37%
1 gen 2002 anni
-2.96
-6.362
-187.01%
1 gen 2003 anni
-1.561
+1.399
-47.27%
1 gen 2004 anni
4.573
+6.134
-393.0%
1 gen 2005 anni
1.392
-3.181
-69.57%
1 gen 2006 anni
4.83
+3.438
247.08%
1 gen 2007 anni
2.398
-2.432
-50.35%
1 gen 2008 anni
-5.047
-7.445
-310.45%
1 gen 2009 anni
-8.773
-3.726
73.82%
1 gen 2010 anni
8.061
+16.834
-191.89%
1 gen 2011 anni
7.817
-0.244
-3.03%
1 gen 2012 anni
-5.563
-13.38
-171.16%
1 gen 2013 anni
1.424
+6.987
-125.6%
1 gen 2014 anni
-0.855
-2.279
-160.02%
1 gen 2015 anni
-3.006
-2.152
251.71%
Classificazione dei paesi secondo i statistiche attuali per anni


Commenti: