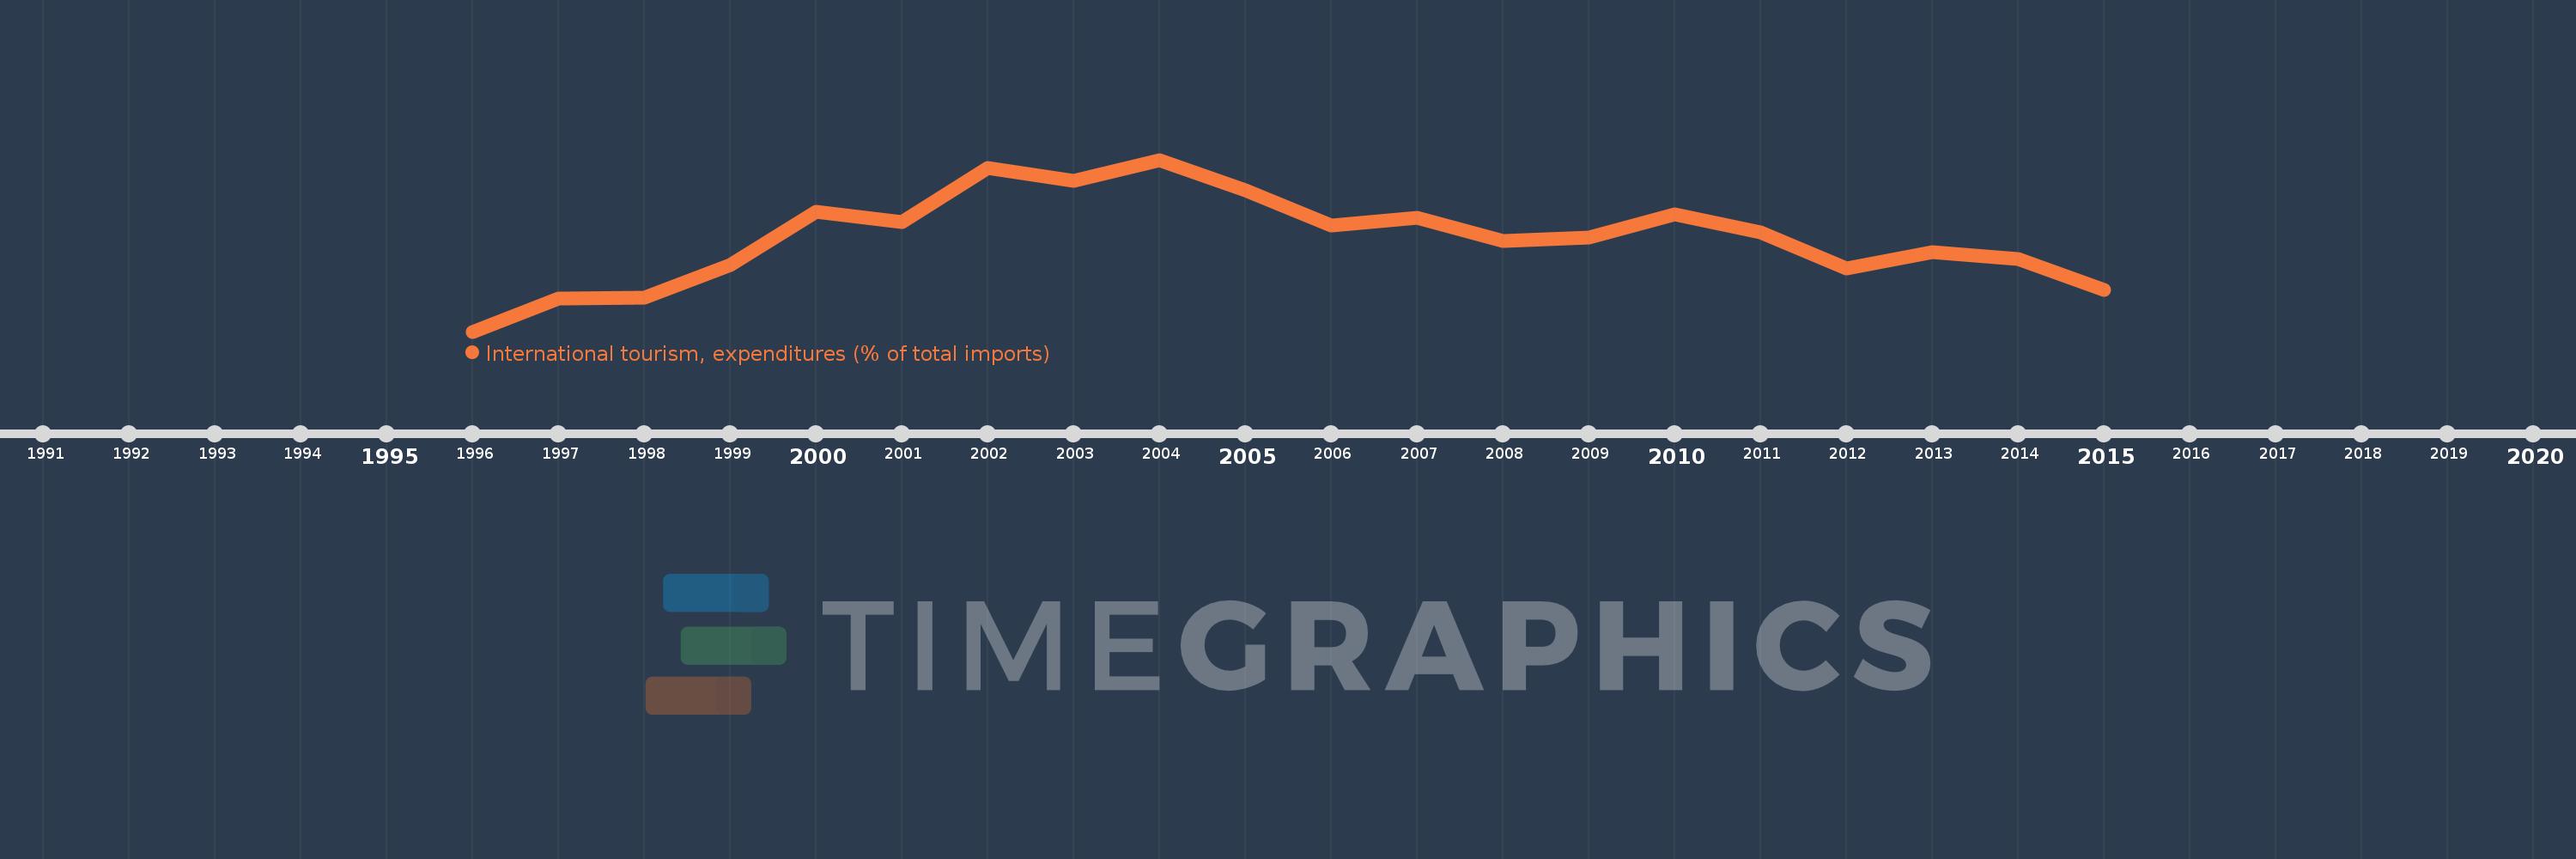
Questa scala temporale mostra un grafico dal 1996 anno al 2015 anno. Cabo Verde. I dati fino ad 1995 anno non disponibili. Il numero di osservazioni attuali secondo i date: 20.
La fonte (nome):
Indicatori dello sviluppo mondiale
La fonte (organizzazione):
World Tourism Organization, Yearbook of Tourism Statistics, Compendium of Tourism Statistics and data files, and IMF and World Bank imports estimates.
Categorie:
Private Sector, Trade
sono stati aggiornati
23 apr 2017 anni
Indicatori delle variazioni dei valori per anni
In media:
12.055
Minima:
6.8
1 gen 1996 anni
Massimo:
16.465
1 gen 2004 anni
Alla data di osservazione
Valore
Variazione assoluta
La variazione rispetto al valore precedente
1 gen 1996 anni
6.8
+6.8
0.0%
1 gen 1997 anni
8.647
+1.847
27.17%
1 gen 1998 anni
8.711
+0.063
0.73%
1 gen 1999 anni
10.55
+1.839
21.12%
1 gen 2000 anni
13.549
+2.999
28.42%
1 gen 2001 anni
12.962
-0.586
-4.33%
1 gen 2002 anni
15.997
+3.034
23.41%
1 gen 2003 anni
15.283
-0.713
-4.46%
1 gen 2004 anni
16.465
+1.182
7.73%
1 gen 2005 anni
14.733
-1.732
-10.52%
1 gen 2006 anni
12.777
-1.956
-13.28%
1 gen 2007 anni
13.187
+0.411
3.22%
1 gen 2008 anni
11.902
-1.285
-9.75%
1 gen 2009 anni
12.087
+0.185
1.56%
1 gen 2010 anni
13.393
+1.305
10.8%
1 gen 2011 anni
12.391
-1.002
-7.48%
1 gen 2012 anni
10.34
-2.051
-16.55%
1 gen 2013 anni
11.287
+0.947
9.16%
1 gen 2014 anni
10.872
-0.415
-3.67%
1 gen 2015 anni
9.159
-1.713
-15.75%
Classificazione dei paesi secondo i statistiche attuali per anni