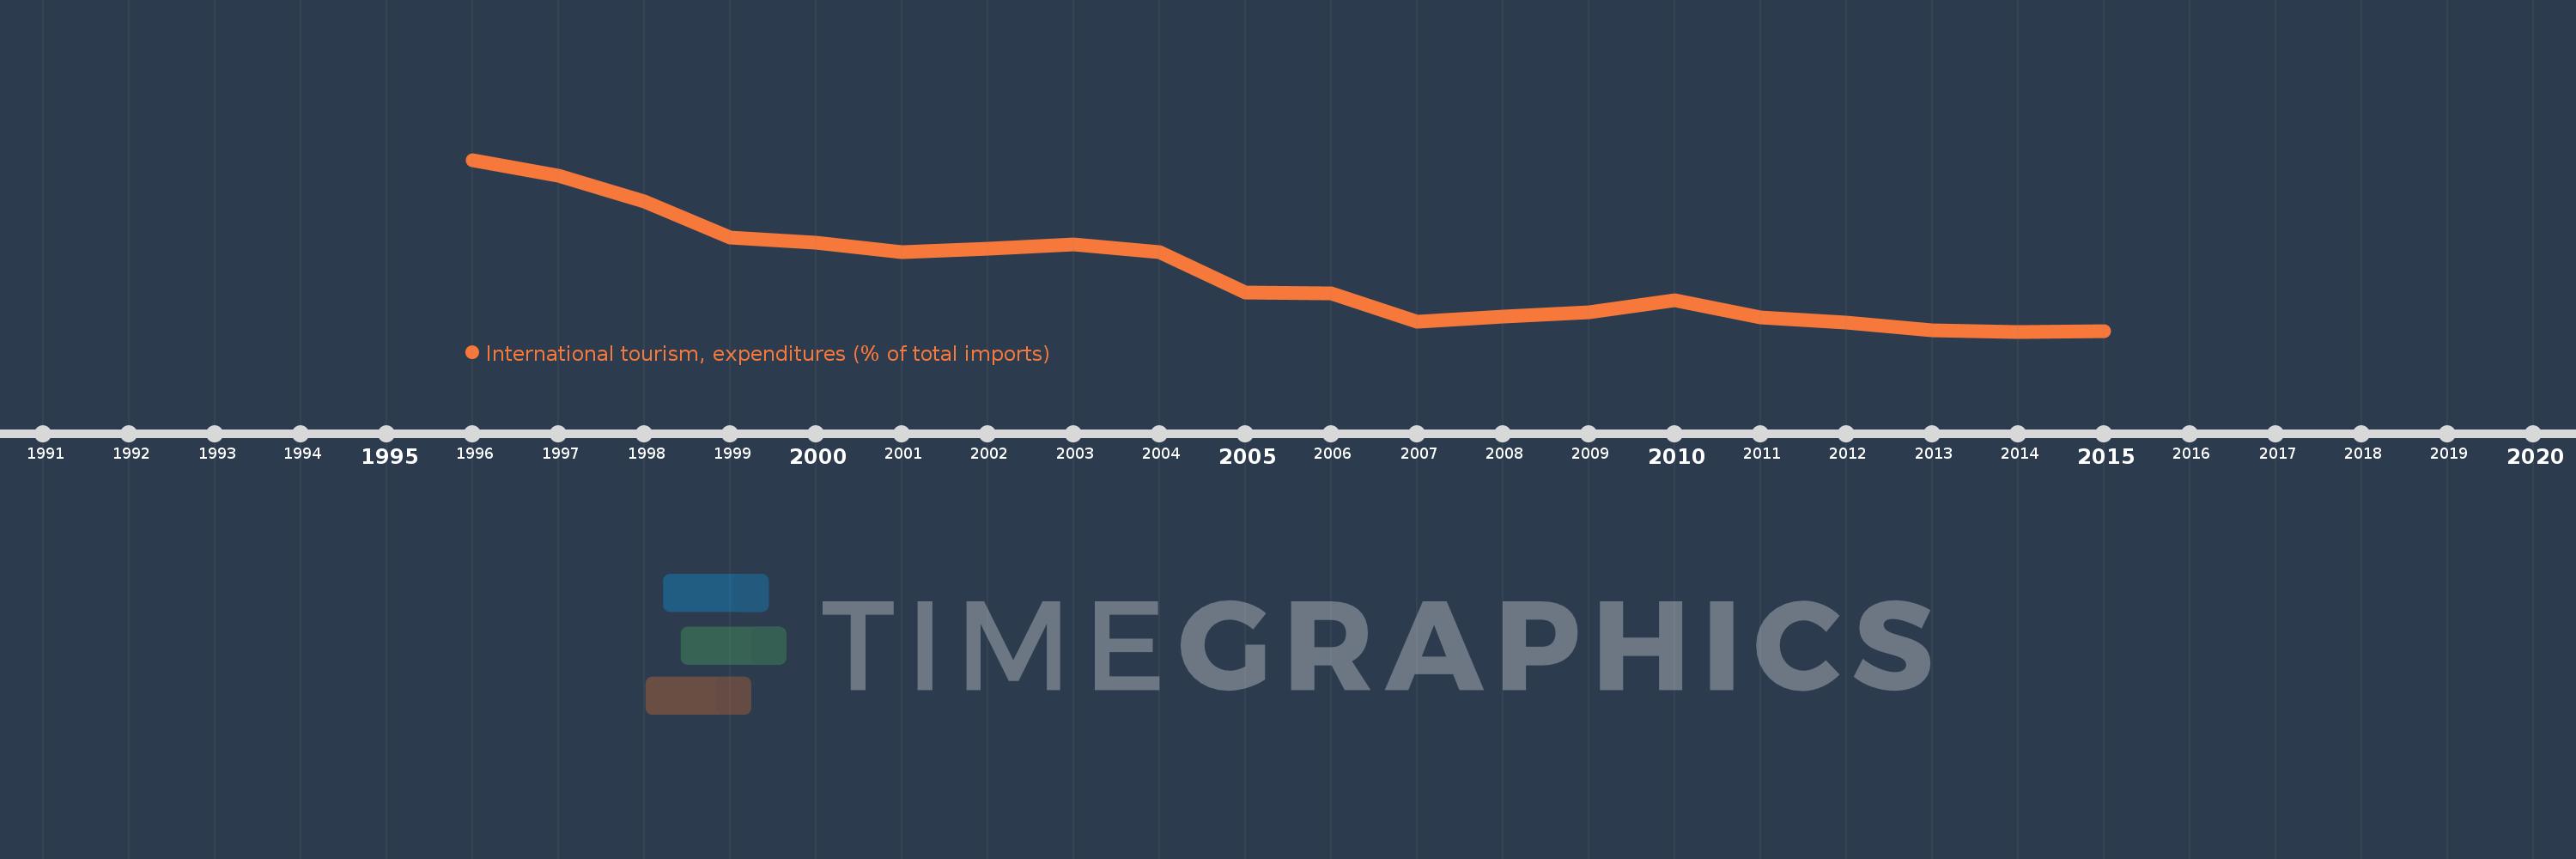
Questa scala temporale mostra un grafico dal 1996 anno al 2015 anno. Hungary. I dati fino ad 1995 anno non disponibili. Il numero di osservazioni attuali secondo i date: 20.
La fonte (nome):
Indicatori dello sviluppo mondiale
La fonte (organizzazione):
World Tourism Organization, Yearbook of Tourism Statistics, Compendium of Tourism Statistics and data files, and IMF and World Bank imports estimates.
Categorie:
Private Sector, Trade
sono stati aggiornati
23 apr 2017 anni
Indicatori delle variazioni dei valori per anni
In media:
4.441
Minima:
2.373
1 gen 2014 anni
Massimo:
8.568
1 gen 1996 anni
Alla data di osservazione
Valore
Variazione assoluta
La variazione rispetto al valore precedente
1 gen 1996 anni
8.568
+8.568
0.0%
1 gen 1997 anni
8.0
-0.568
-6.63%
1 gen 1998 anni
7.054
-0.946
-11.83%
1 gen 1999 anni
5.752
-1.302
-18.45%
1 gen 2000 anni
5.593
-0.159
-2.76%
1 gen 2001 anni
5.238
-0.355
-6.35%
1 gen 2002 anni
5.371
+0.133
2.53%
1 gen 2003 anni
5.522
+0.151
2.82%
1 gen 2004 anni
5.242
-0.28
-5.06%
1 gen 2005 anni
3.771
-1.471
-28.07%
1 gen 2006 anni
3.746
-0.025
-0.67%
1 gen 2007 anni
2.731
-1.015
-27.09%
1 gen 2008 anni
2.914
+0.182
6.68%
1 gen 2009 anni
3.068
+0.154
5.29%
1 gen 2010 anni
3.511
+0.444
14.47%
1 gen 2011 anni
2.894
-0.617
-17.58%
1 gen 2012 anni
2.684
-0.21
-7.27%
1 gen 2013 anni
2.411
-0.273
-10.16%
1 gen 2014 anni
2.373
-0.038
-1.59%
1 gen 2015 anni
2.386
+0.014
0.57%
Classificazione dei paesi secondo i statistiche attuali per anni