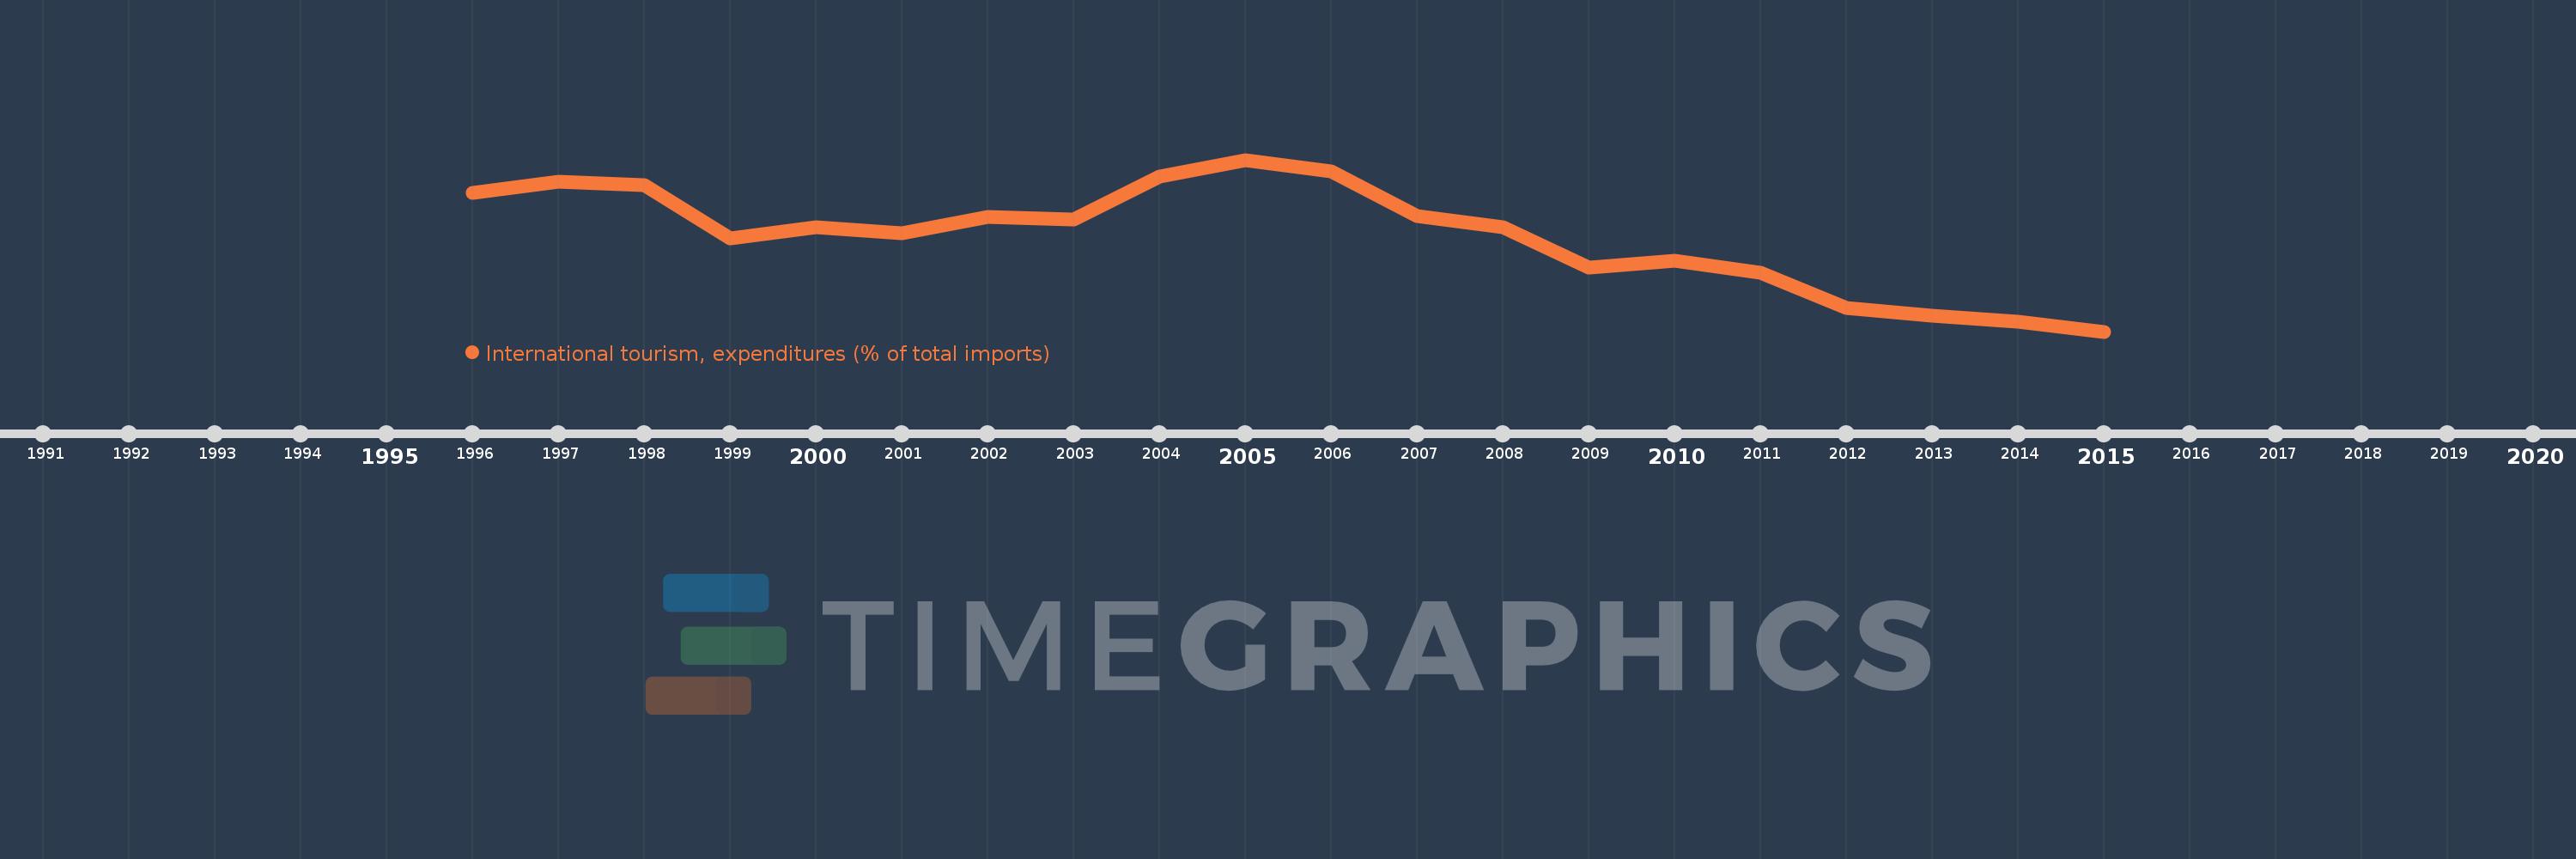
Questa scala temporale mostra un grafico dal 1996 anno al 2015 anno. Bahamas, The. I dati fino ad 1995 anno non disponibili. Il numero di osservazioni attuali secondo i date: 20.
La fonte (nome):
Indicatori dello sviluppo mondiale
La fonte (organizzazione):
World Tourism Organization, Yearbook of Tourism Statistics, Compendium of Tourism Statistics and data files, and IMF and World Bank imports estimates.
Categorie:
Private Sector, Trade
sono stati aggiornati
23 apr 2017 anni
Indicatori delle variazioni dei valori per anni
In media:
11.447
Minima:
7.083
1 gen 2015 anni
Massimo:
14.945
1 gen 2005 anni
Alla data di osservazione
Valore
Variazione assoluta
La variazione rispetto al valore precedente
1 gen 1996 anni
13.42
+13.42
0.0%
1 gen 1997 anni
13.928
+0.508
3.78%
1 gen 1998 anni
13.798
-0.13
-0.93%
1 gen 1999 anni
11.364
-2.434
-17.64%
1 gen 2000 anni
11.874
+0.51
4.49%
1 gen 2001 anni
11.566
-0.308
-2.59%
1 gen 2002 anni
12.314
+0.748
6.46%
1 gen 2003 anni
12.223
-0.09
-0.73%
1 gen 2004 anni
14.171
+1.947
15.93%
1 gen 2005 anni
14.945
+0.775
5.47%
1 gen 2006 anni
14.411
-0.534
-3.57%
1 gen 2007 anni
12.359
-2.052
-14.24%
1 gen 2008 anni
11.859
-0.5
-4.04%
1 gen 2009 anni
9.996
-1.864
-15.71%
1 gen 2010 anni
10.343
+0.348
3.48%
1 gen 2011 anni
9.781
-0.562
-5.44%
1 gen 2012 anni
8.149
-1.632
-16.68%
1 gen 2013 anni
7.8
-0.349
-4.29%
1 gen 2014 anni
7.551
-0.249
-3.19%
1 gen 2015 anni
7.083
-0.468
-6.2%
Classificazione dei paesi secondo i statistiche attuali per anni