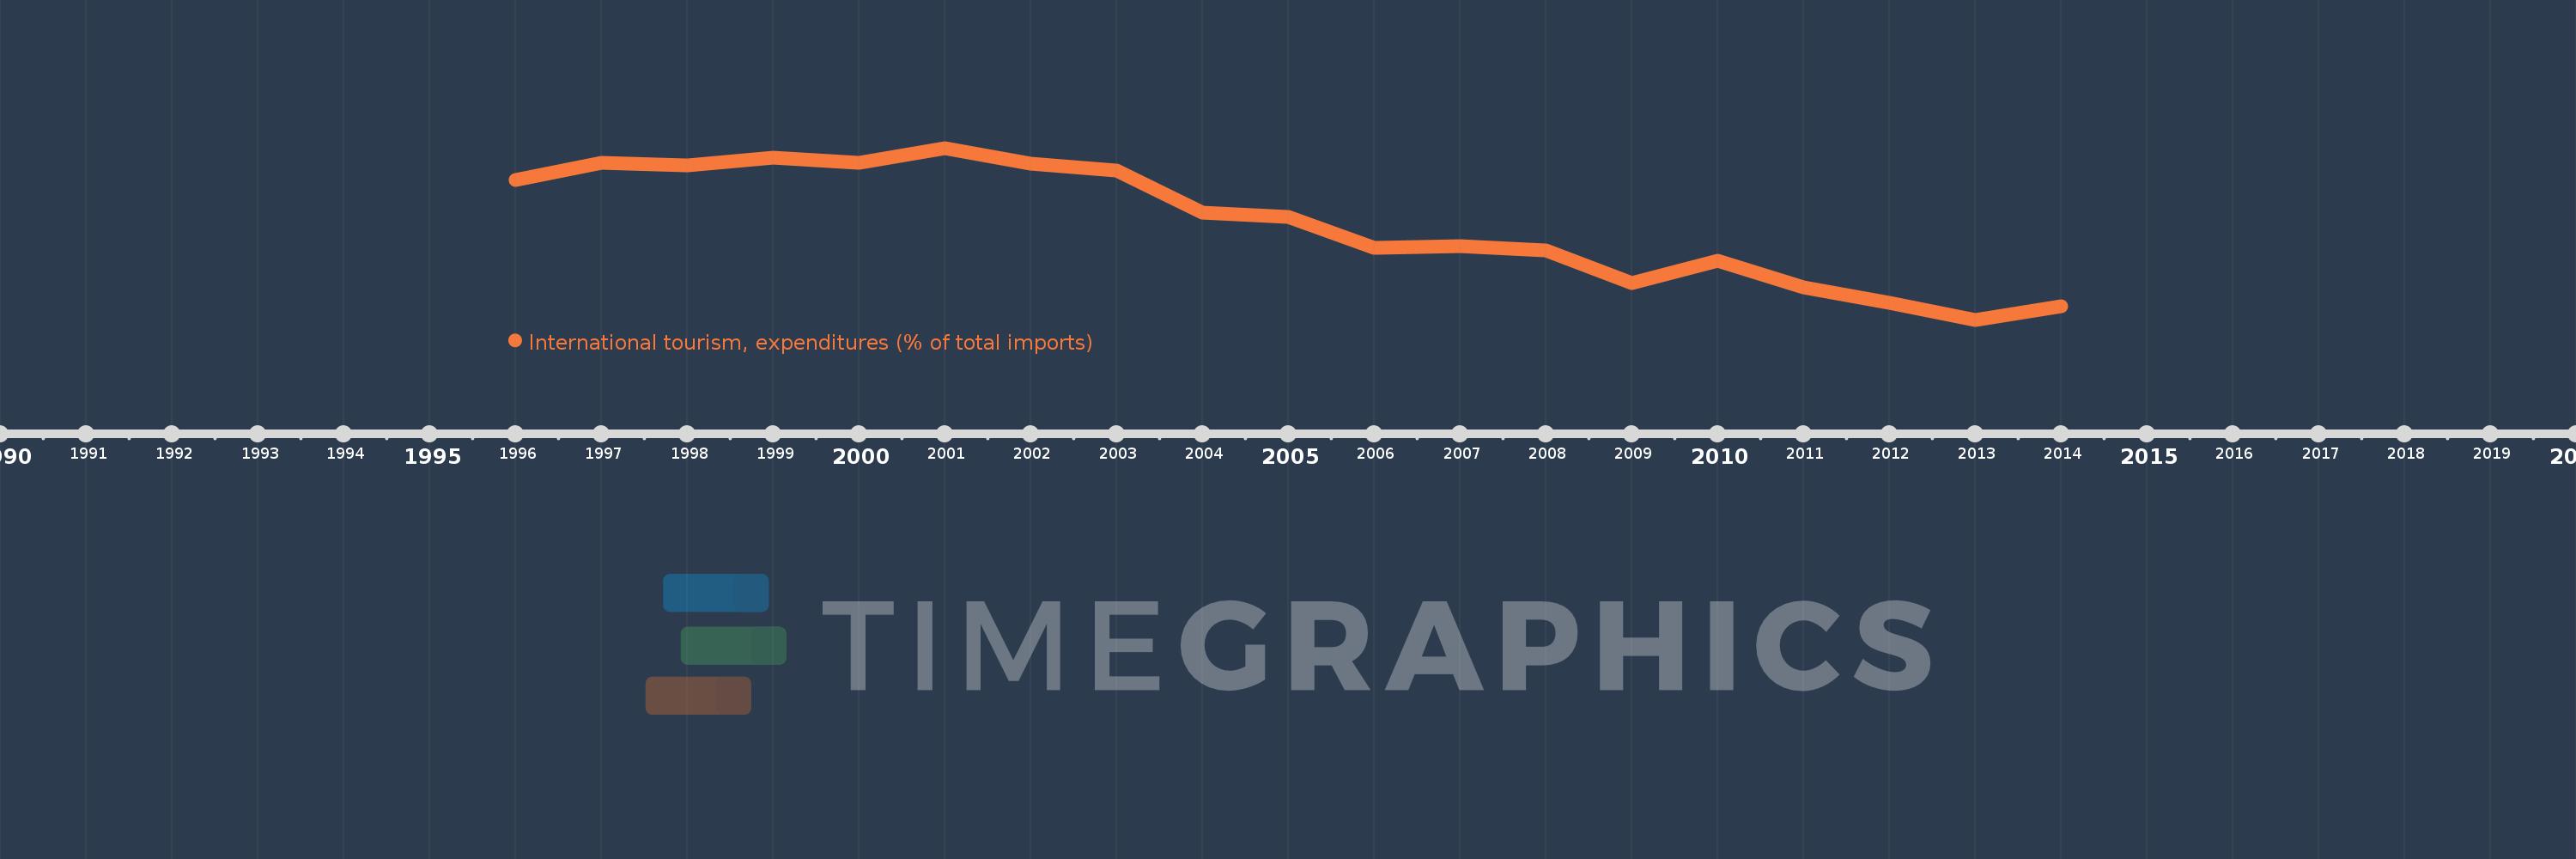
Questa scala temporale mostra un grafico dal 1996 anno al 2014 anno. Low income. I dati fino ad 1995 anno non disponibili. Il numero di osservazioni attuali secondo i date: 19.
La fonte (nome):
Indicatori dello sviluppo mondiale
La fonte (organizzazione):
World Tourism Organization, Yearbook of Tourism Statistics, Compendium of Tourism Statistics and data files, and IMF and World Bank imports estimates.
Categorie:
Private Sector, Trade
sono stati aggiornati
23 apr 2017 anni
Indicatori delle variazioni dei valori per anni
In media:
6.686
Minima:
3.898
1 gen 2013 anni
Massimo:
8.87
1 gen 2001 anni
Alla data di osservazione
Valore
Variazione assoluta
La variazione rispetto al valore precedente
1 gen 1996 anni
7.931
+7.931
0.0%
1 gen 1997 anni
8.449
+0.518
6.53%
1 gen 1998 anni
8.355
-0.094
-1.11%
1 gen 1999 anni
8.585
+0.23
2.76%
1 gen 2000 anni
8.448
-0.137
-1.59%
1 gen 2001 anni
8.87
+0.421
4.99%
1 gen 2002 anni
8.412
-0.458
-5.16%
1 gen 2003 anni
8.211
-0.201
-2.39%
1 gen 2004 anni
6.989
-1.222
-14.88%
1 gen 2005 anni
6.877
-0.112
-1.6%
1 gen 2006 anni
5.985
-0.892
-12.97%
1 gen 2007 anni
6.037
+0.052
0.86%
1 gen 2008 anni
5.911
-0.126
-2.09%
1 gen 2009 anni
4.949
-0.962
-16.27%
1 gen 2010 anni
5.6
+0.651
13.15%
1 gen 2011 anni
4.841
-0.759
-13.55%
1 gen 2012 anni
4.385
-0.456
-9.41%
1 gen 2013 anni
3.898
-0.488
-11.12%
1 gen 2014 anni
4.296
+0.399
10.23%
Classificazione dei paesi secondo i statistiche attuali per anni