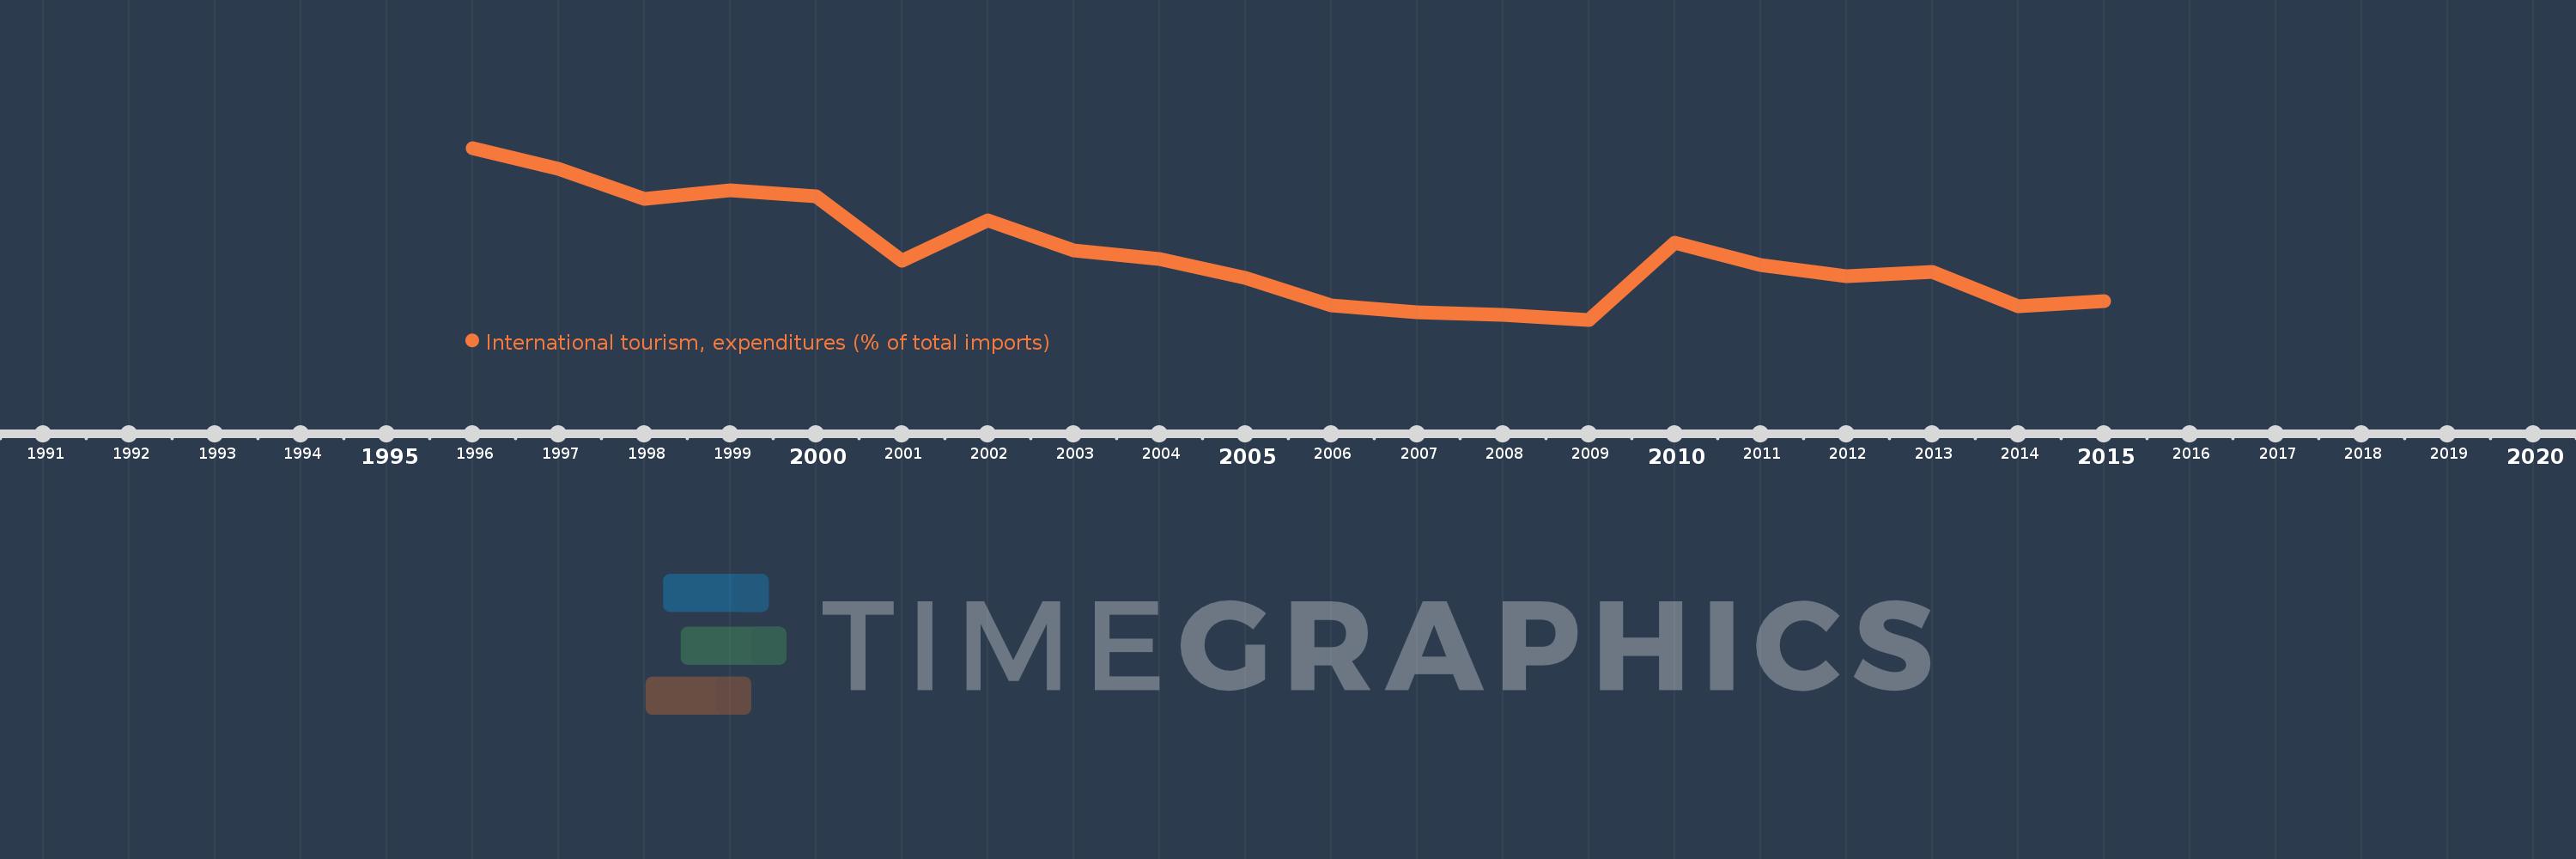
Questa scala temporale mostra un grafico dal 1996 anno al 2015 anno. Finland. I dati fino ad 1995 anno non disponibili. Il numero di osservazioni attuali secondo i date: 20.
La fonte (nome):
Indicatori dello sviluppo mondiale
La fonte (organizzazione):
World Tourism Organization, Yearbook of Tourism Statistics, Compendium of Tourism Statistics and data files, and IMF and World Bank imports estimates.
Categorie:
Private Sector, Trade
sono stati aggiornati
23 apr 2017 anni
Indicatori delle variazioni dei valori per anni
In media:
5.875
Minima:
4.734
1 gen 2009 anni
Massimo:
7.731
1 gen 1996 anni
Alla data di osservazione
Valore
Variazione assoluta
La variazione rispetto al valore precedente
1 gen 1996 anni
7.731
+7.731
0.0%
1 gen 1997 anni
7.371
-0.36
-4.65%
1 gen 1998 anni
6.846
-0.525
-7.13%
1 gen 1999 anni
6.989
+0.143
2.08%
1 gen 2000 anni
6.884
-0.105
-1.5%
1 gen 2001 anni
5.76
-1.124
-16.33%
1 gen 2002 anni
6.461
+0.701
12.17%
1 gen 2003 anni
5.937
-0.524
-8.11%
1 gen 2004 anni
5.799
-0.139
-2.33%
1 gen 2005 anni
5.468
-0.33
-5.7%
1 gen 2006 anni
4.986
-0.482
-8.81%
1 gen 2007 anni
4.859
-0.127
-2.55%
1 gen 2008 anni
4.816
-0.043
-0.88%
1 gen 2009 anni
4.734
-0.082
-1.71%
1 gen 2010 anni
6.072
+1.338
28.26%
1 gen 2011 anni
5.692
-0.38
-6.26%
1 gen 2012 anni
5.499
-0.193
-3.39%
1 gen 2013 anni
5.575
+0.076
1.39%
1 gen 2014 anni
4.964
-0.611
-10.97%
1 gen 2015 anni
5.057
+0.093
1.87%
Classificazione dei paesi secondo i statistiche attuali per anni