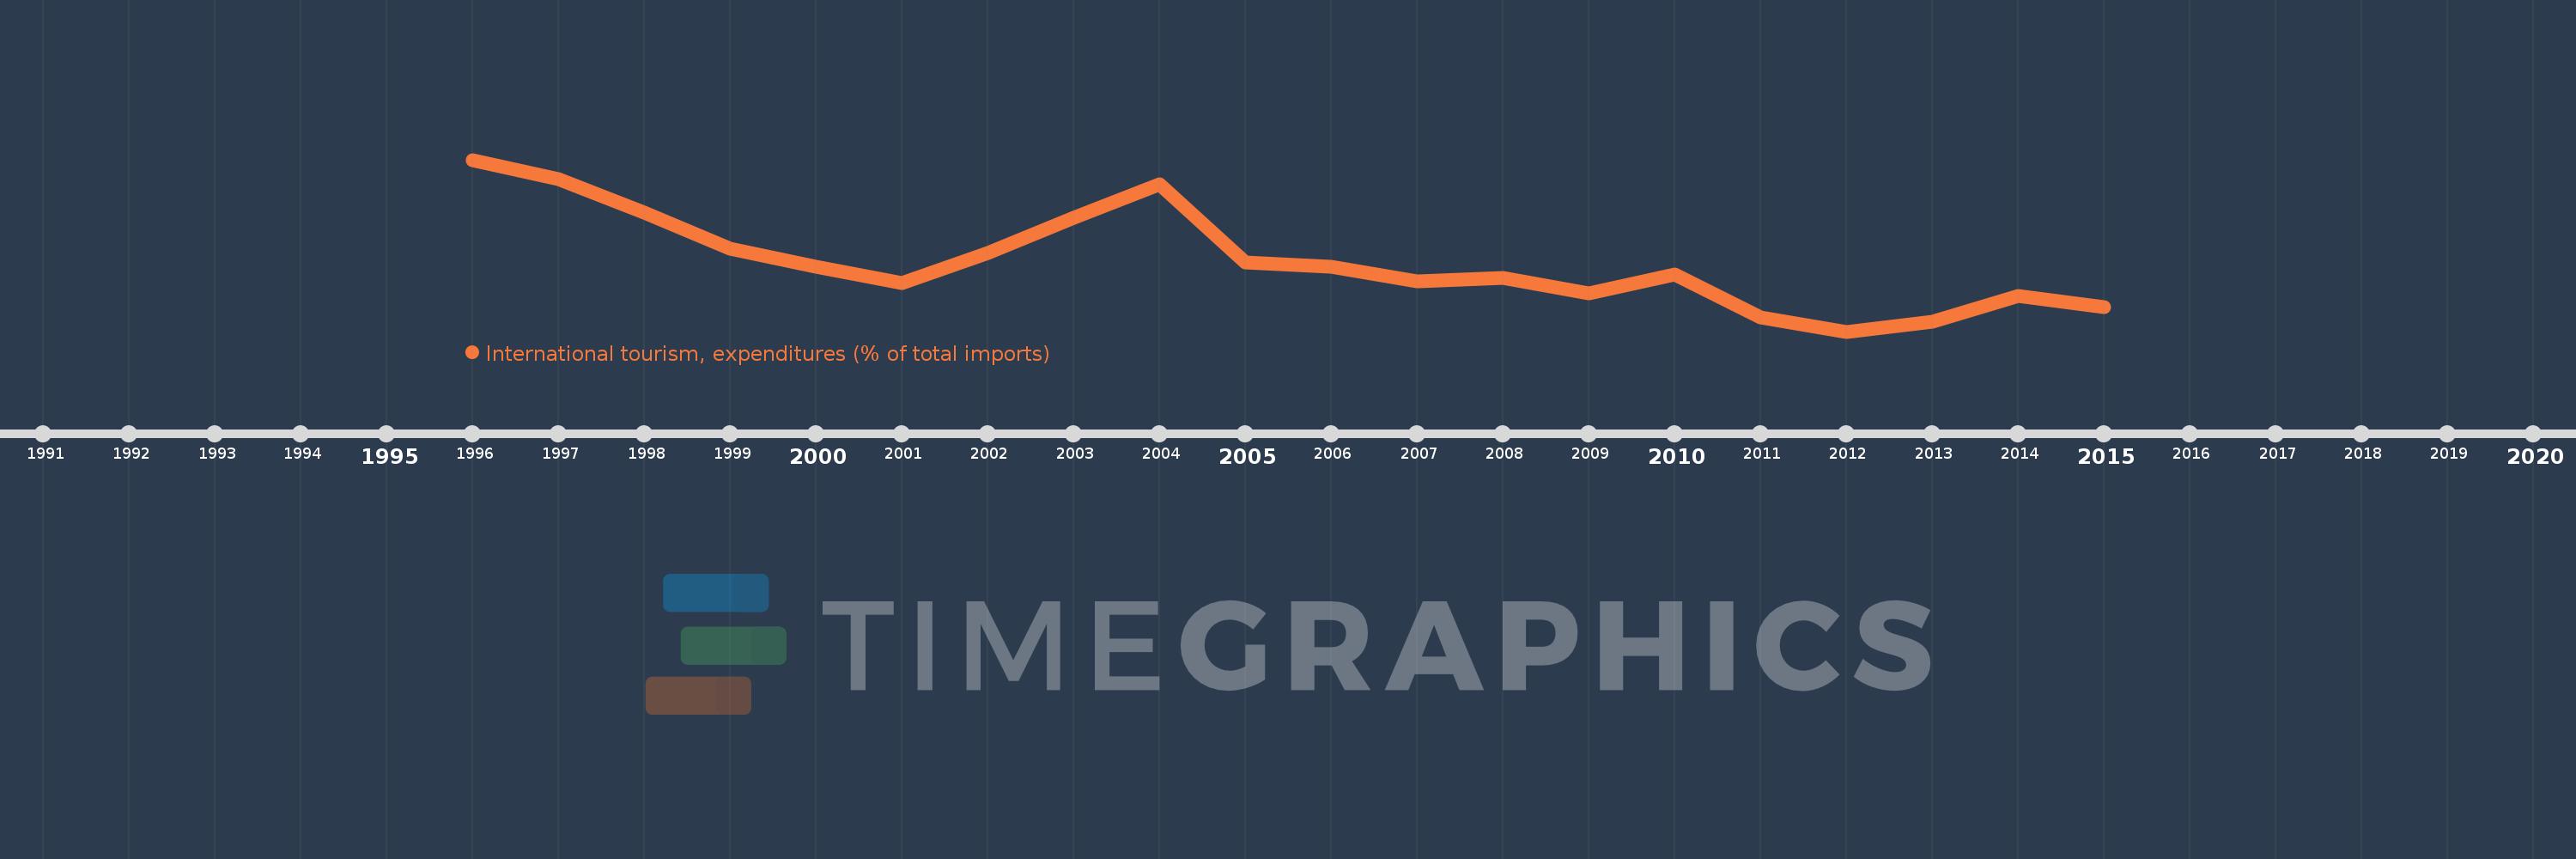
Questa scala temporale mostra un grafico dal 1996 anno al 2015 anno. Egypt, Arab Rep.. I dati fino ad 1995 anno non disponibili. Il numero di osservazioni attuali secondo i date: 20.
La fonte (nome):
Indicatori dello sviluppo mondiale
La fonte (organizzazione):
World Tourism Organization, Yearbook of Tourism Statistics, Compendium of Tourism Statistics and data files, and IMF and World Bank imports estimates.
Categorie:
Private Sector, Trade
sono stati aggiornati
23 apr 2017 anni
Indicatori delle variazioni dei valori per anni
In media:
5.742
Minima:
4.195
1 gen 2012 anni
Massimo:
7.999
1 gen 1996 anni
Alla data di osservazione
Valore
Variazione assoluta
La variazione rispetto al valore precedente
1 gen 1996 anni
7.999
+7.999
0.0%
1 gen 1997 anni
7.571
-0.427
-5.34%
1 gen 1998 anni
6.838
-0.733
-9.68%
1 gen 1999 anni
6.021
-0.817
-11.95%
1 gen 2000 anni
5.635
-0.386
-6.42%
1 gen 2001 anni
5.268
-0.367
-6.52%
1 gen 2002 anni
5.944
+0.676
12.84%
1 gen 2003 anni
6.71
+0.766
12.89%
1 gen 2004 anni
7.451
+0.741
11.04%
1 gen 2005 anni
5.733
-1.718
-23.06%
1 gen 2006 anni
5.628
-0.104
-1.82%
1 gen 2007 anni
5.317
-0.312
-5.54%
1 gen 2008 anni
5.375
+0.058
1.09%
1 gen 2009 anni
5.043
-0.332
-6.17%
1 gen 2010 anni
5.462
+0.419
8.32%
1 gen 2011 anni
4.504
-0.959
-17.55%
1 gen 2012 anni
4.195
-0.309
-6.85%
1 gen 2013 anni
4.414
+0.219
5.22%
1 gen 2014 anni
4.992
+0.578
13.09%
1 gen 2015 anni
4.732
-0.26
-5.21%
Classificazione dei paesi secondo i statistiche attuali per anni