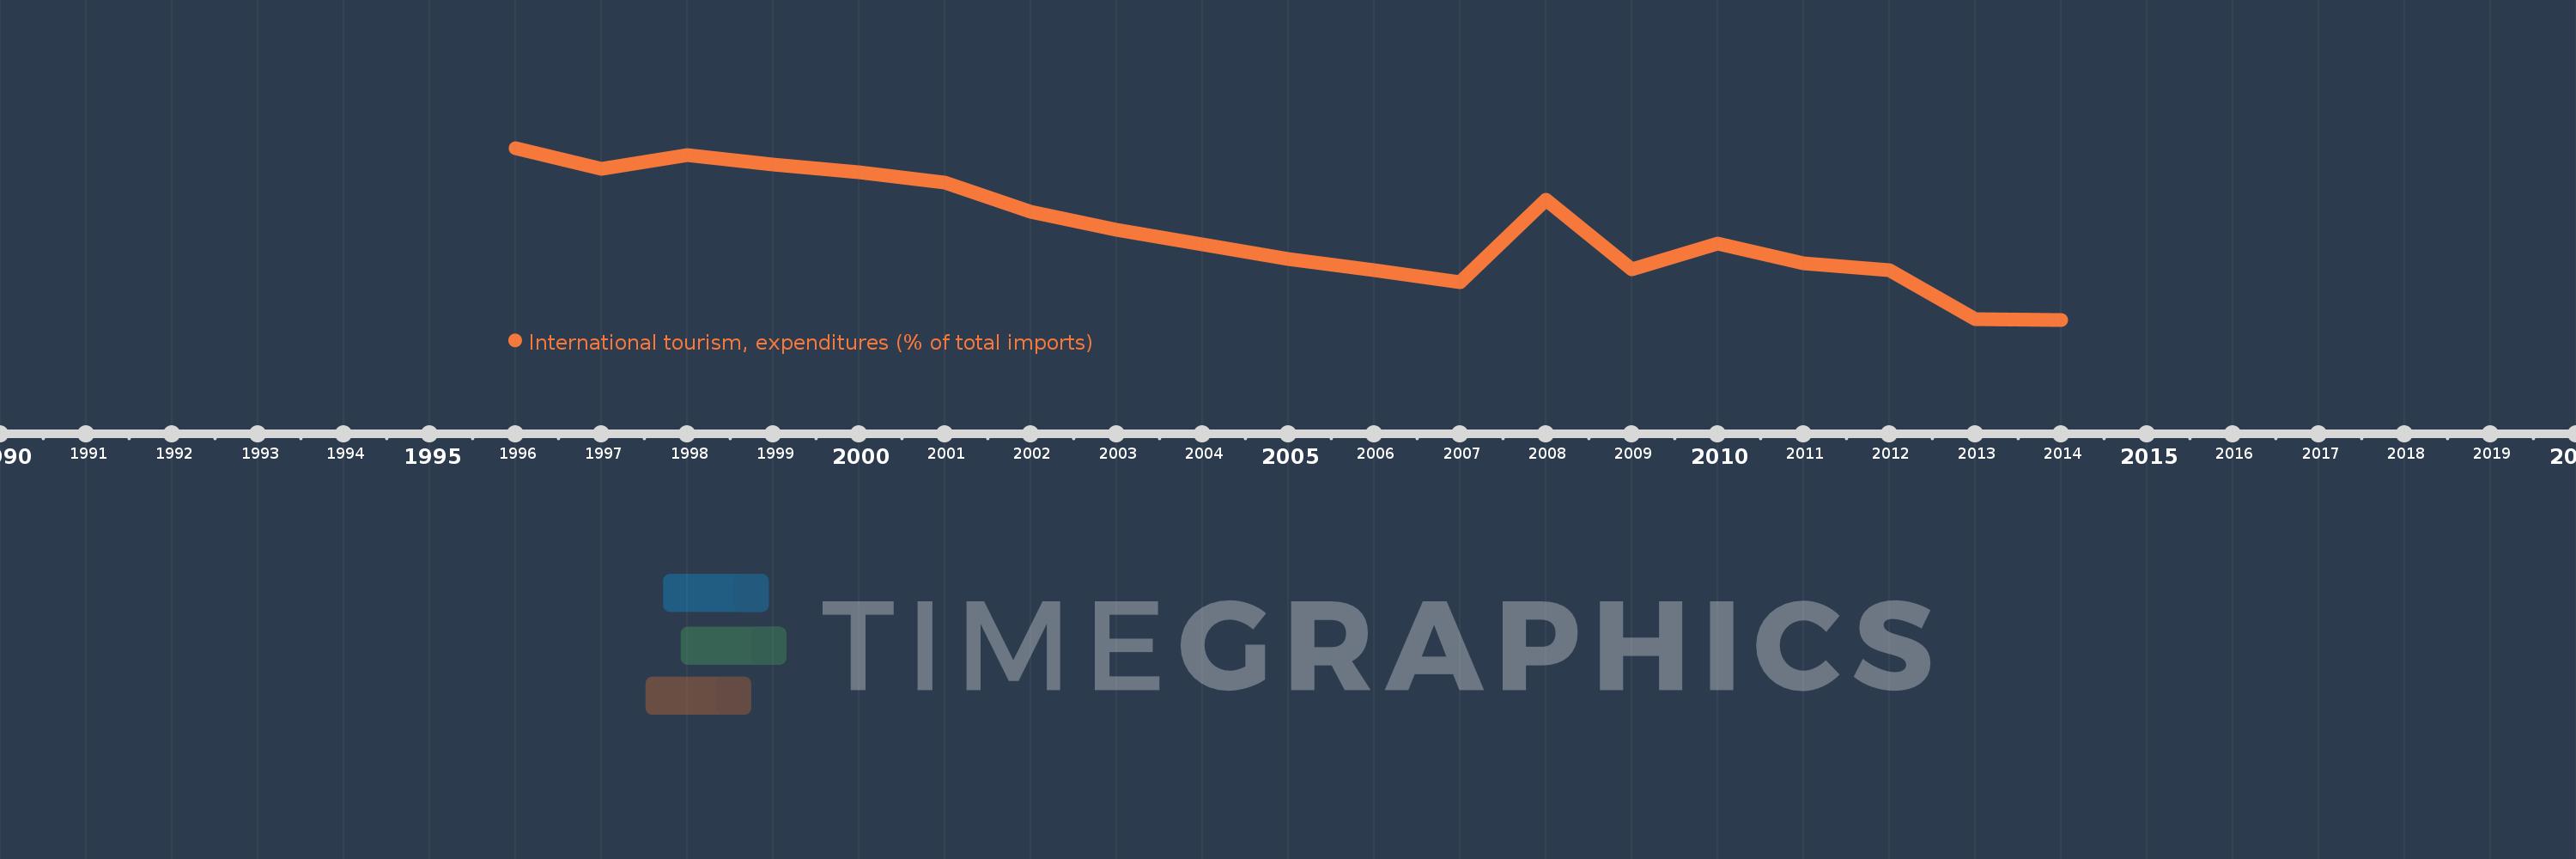
Questa scala temporale mostra un grafico dal 1996 anno al 2014 anno. Senegal. I dati fino ad 1995 anno non disponibili. Il numero di osservazioni attuali secondo i date: 19.
La fonte (nome):
Indicatori dello sviluppo mondiale
La fonte (organizzazione):
World Tourism Organization, Yearbook of Tourism Statistics, Compendium of Tourism Statistics and data files, and IMF and World Bank imports estimates.
Categorie:
Private Sector, Trade
sono stati aggiornati
23 apr 2017 anni
Indicatori delle variazioni dei valori per anni
In media:
5.391
Minima:
2.055
1 gen 2014 anni
Massimo:
8.456
1 gen 1996 anni
Alla data di osservazione
Valore
Variazione assoluta
La variazione rispetto al valore precedente
1 gen 1996 anni
8.456
+8.456
0.0%
1 gen 1997 anni
7.671
-0.785
-9.29%
1 gen 1998 anni
8.188
+0.517
6.74%
1 gen 1999 anni
7.834
-0.354
-4.33%
1 gen 2000 anni
7.546
-0.288
-3.67%
1 gen 2001 anni
7.179
-0.367
-4.86%
1 gen 2002 anni
6.084
-1.096
-15.26%
1 gen 2003 anni
5.394
-0.69
-11.33%
1 gen 2004 anni
4.866
-0.529
-9.8%
1 gen 2005 anni
4.325
-0.54
-11.1%
1 gen 2006 anni
3.897
-0.428
-9.9%
1 gen 2007 anni
3.445
-0.453
-11.61%
1 gen 2008 anni
6.518
+3.073
89.22%
1 gen 2009 anni
3.935
-2.583
-39.63%
1 gen 2010 anni
4.894
+0.959
24.38%
1 gen 2011 anni
4.172
-0.722
-14.75%
1 gen 2012 anni
3.894
-0.278
-6.67%
1 gen 2013 anni
2.071
-1.823
-46.81%
1 gen 2014 anni
2.055
-0.016
-0.78%
Classificazione dei paesi secondo i statistiche attuali per anni