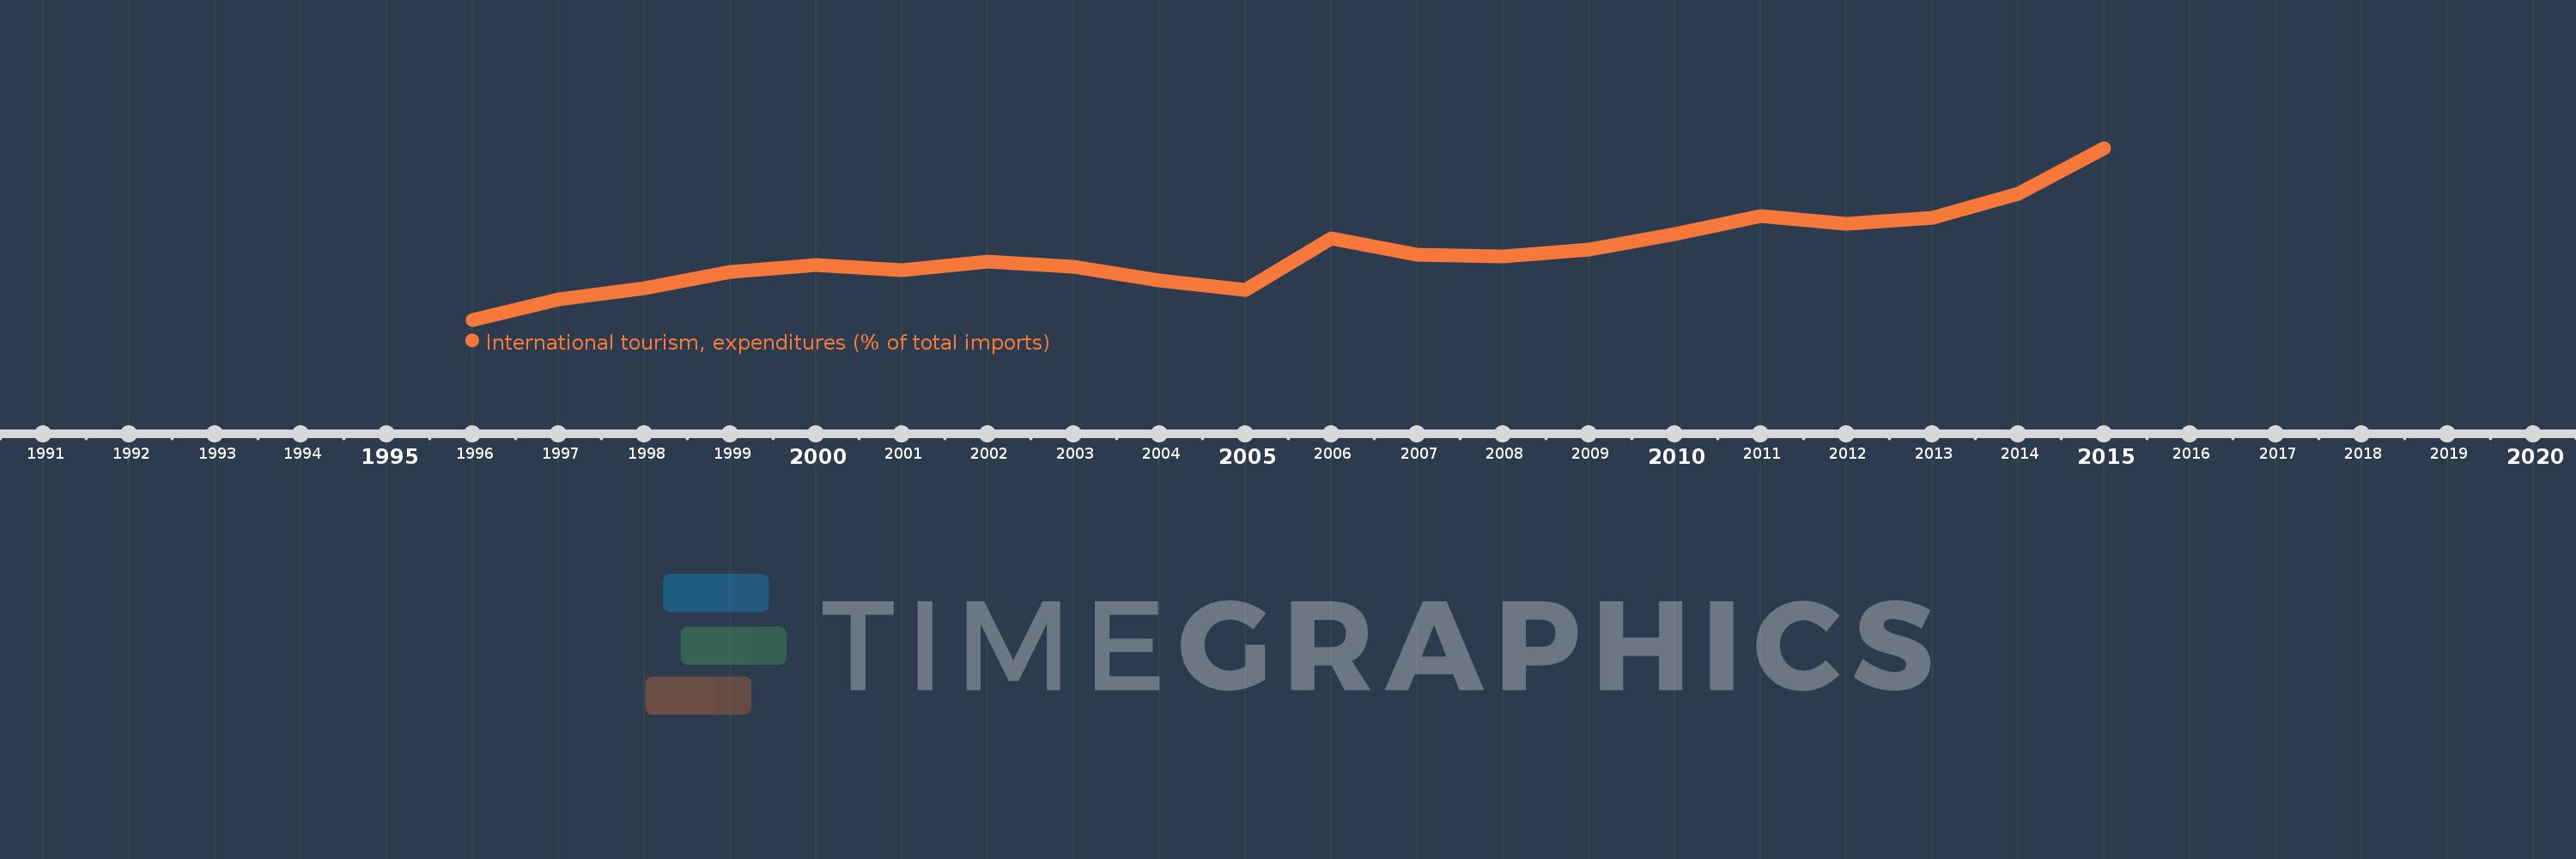
Questa scala temporale mostra un grafico dal 1996 anno al 2015 anno. Philippines. I dati fino ad 1995 anno non disponibili. Il numero di osservazioni attuali secondo i date: 20.
La fonte (nome):
Indicatori dello sviluppo mondiale
La fonte (organizzazione):
World Tourism Organization, Yearbook of Tourism Statistics, Compendium of Tourism Statistics and data files, and IMF and World Bank imports estimates.
Categorie:
Private Sector, Trade
sono stati aggiornati
23 apr 2017 anni
Indicatori delle variazioni dei valori per anni
In media:
6.486
Minima:
1.654
1 gen 1996 anni
Massimo:
13.96
1 gen 2015 anni
Alla data di osservazione
Valore
Variazione assoluta
La variazione rispetto al valore precedente
1 gen 1996 anni
1.654
+1.654
0.0%
1 gen 1997 anni
3.115
+1.461
88.36%
1 gen 1998 anni
3.901
+0.786
25.22%
1 gen 1999 anni
5.102
+1.201
30.8%
1 gen 2000 anni
5.572
+0.47
9.2%
1 gen 2001 anni
5.215
-0.357
-6.4%
1 gen 2002 anni
5.817
+0.602
11.54%
1 gen 2003 anni
5.42
-0.397
-6.82%
1 gen 2004 anni
4.454
-0.966
-17.82%
1 gen 2005 anni
3.813
-0.641
-14.4%
1 gen 2006 anni
7.507
+3.694
96.9%
1 gen 2007 anni
6.304
-1.204
-16.03%
1 gen 2008 anni
6.17
-0.134
-2.12%
1 gen 2009 anni
6.653
+0.483
7.83%
1 gen 2010 anni
7.772
+1.119
16.82%
1 gen 2011 anni
9.085
+1.313
16.9%
1 gen 2012 anni
8.526
-0.559
-6.15%
1 gen 2013 anni
8.973
+0.447
5.25%
1 gen 2014 anni
10.701
+1.728
19.26%
1 gen 2015 anni
13.96
+3.258
30.45%
Classificazione dei paesi secondo i statistiche attuali per anni