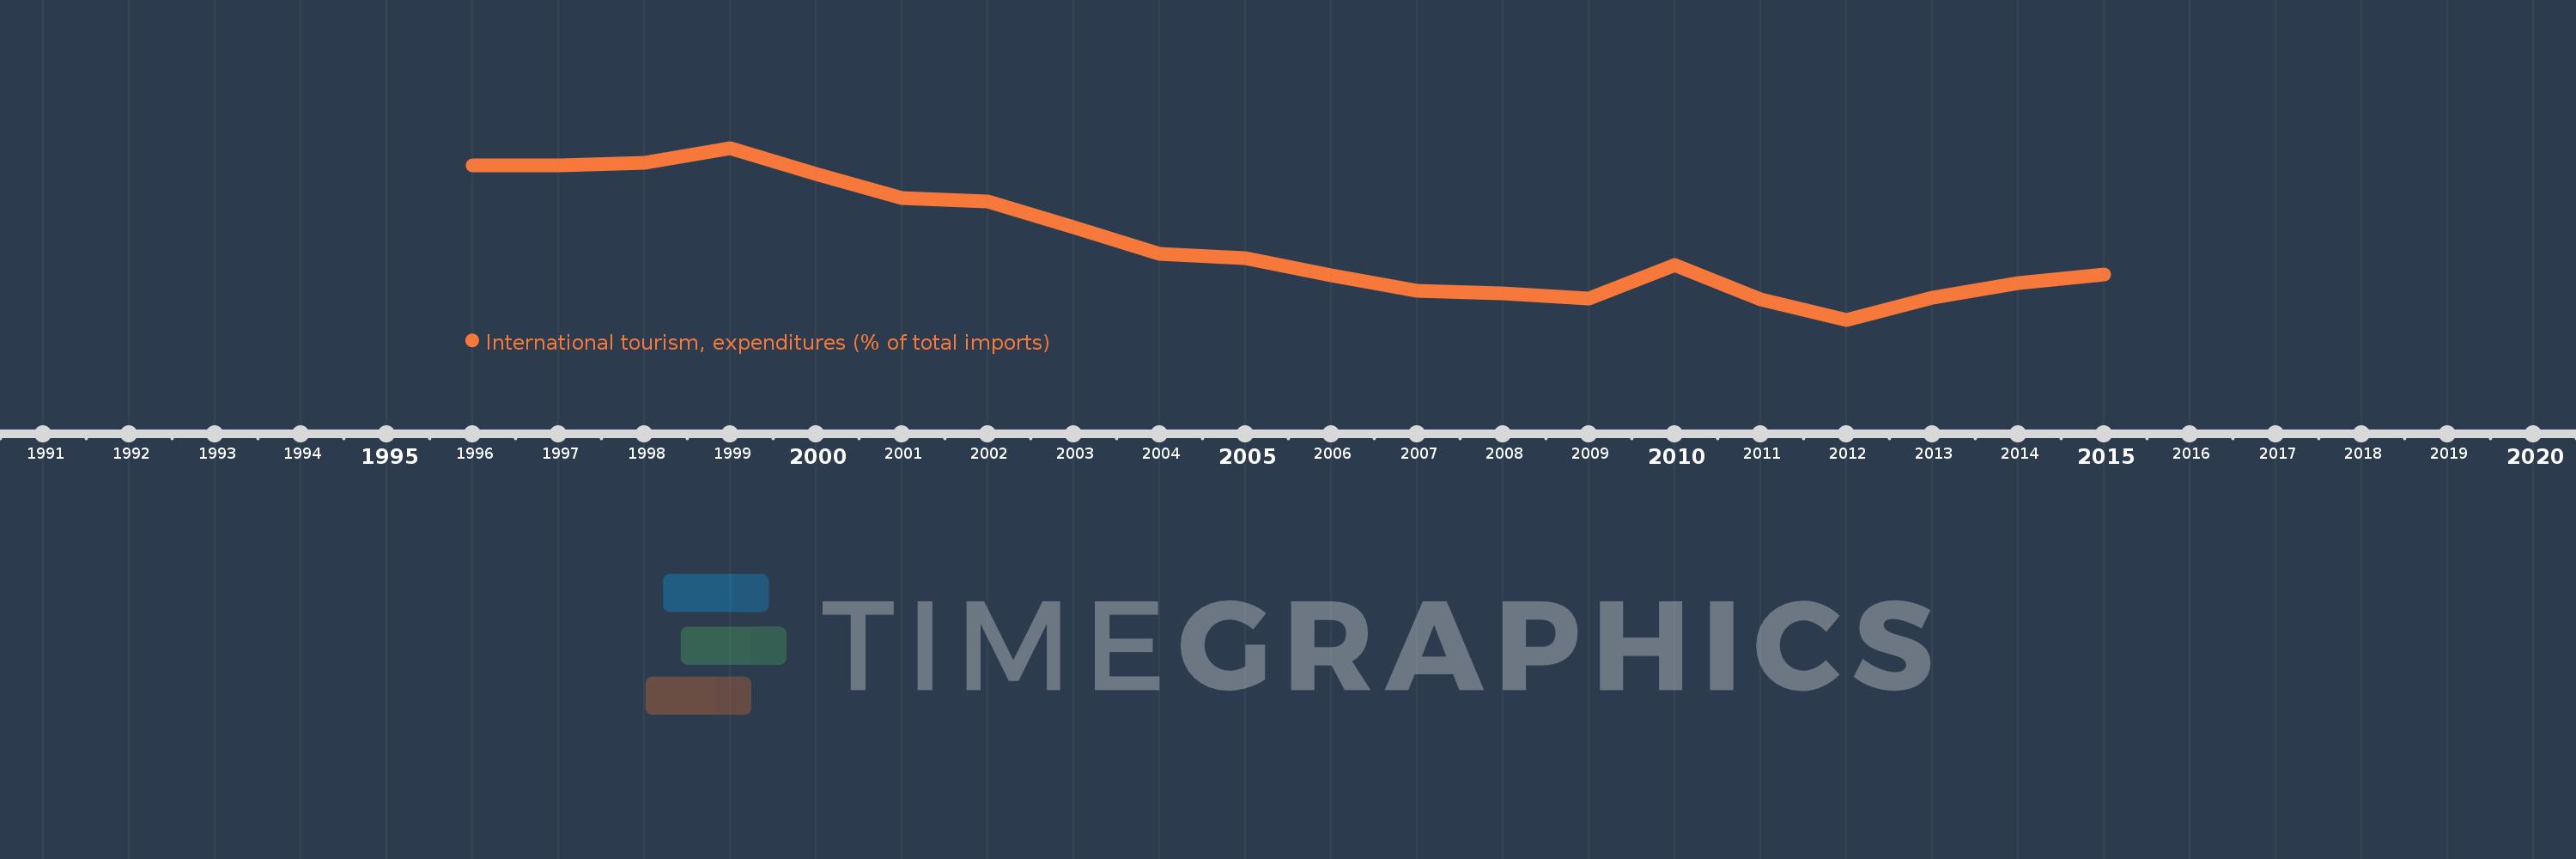
Questa scala temporale mostra un grafico dal 1996 anno al 2015 anno. United States. I dati fino ad 1995 anno non disponibili. Il numero di osservazioni attuali secondo i date: 20.
La fonte (nome):
Indicatori dello sviluppo mondiale
La fonte (organizzazione):
World Tourism Organization, Yearbook of Tourism Statistics, Compendium of Tourism Statistics and data files, and IMF and World Bank imports estimates.
Categorie:
Private Sector, Trade
sono stati aggiornati
23 apr 2017 anni
Indicatori delle variazioni dei valori per anni
In media:
5.602
Minima:
4.352
1 gen 2012 anni
Massimo:
7.134
1 gen 1999 anni
Alla data di osservazione
Valore
Variazione assoluta
La variazione rispetto al valore precedente
1 gen 1996 anni
6.853
+6.853
0.0%
1 gen 1997 anni
6.851
-0.001
-0.02%
1 gen 1998 anni
6.9
+0.048
0.71%
1 gen 1999 anni
7.134
+0.234
3.39%
1 gen 2000 anni
6.717
-0.417
-5.85%
1 gen 2001 anni
6.318
-0.399
-5.94%
1 gen 2002 anni
6.262
-0.056
-0.89%
1 gen 2003 anni
5.857
-0.405
-6.47%
1 gen 2004 anni
5.421
-0.436
-7.44%
1 gen 2005 anni
5.35
-0.071
-1.32%
1 gen 2006 anni
5.07
-0.279
-5.22%
1 gen 2007 anni
4.814
-0.256
-5.05%
1 gen 2008 anni
4.781
-0.033
-0.69%
1 gen 2009 anni
4.699
-0.082
-1.72%
1 gen 2010 anni
5.234
+0.536
11.4%
1 gen 2011 anni
4.686
-0.548
-10.47%
1 gen 2012 anni
4.352
-0.334
-7.13%
1 gen 2013 anni
4.714
+0.362
8.31%
1 gen 2014 anni
4.941
+0.227
4.82%
1 gen 2015 anni
5.082
+0.141
2.85%
Classificazione dei paesi secondo i statistiche attuali per anni