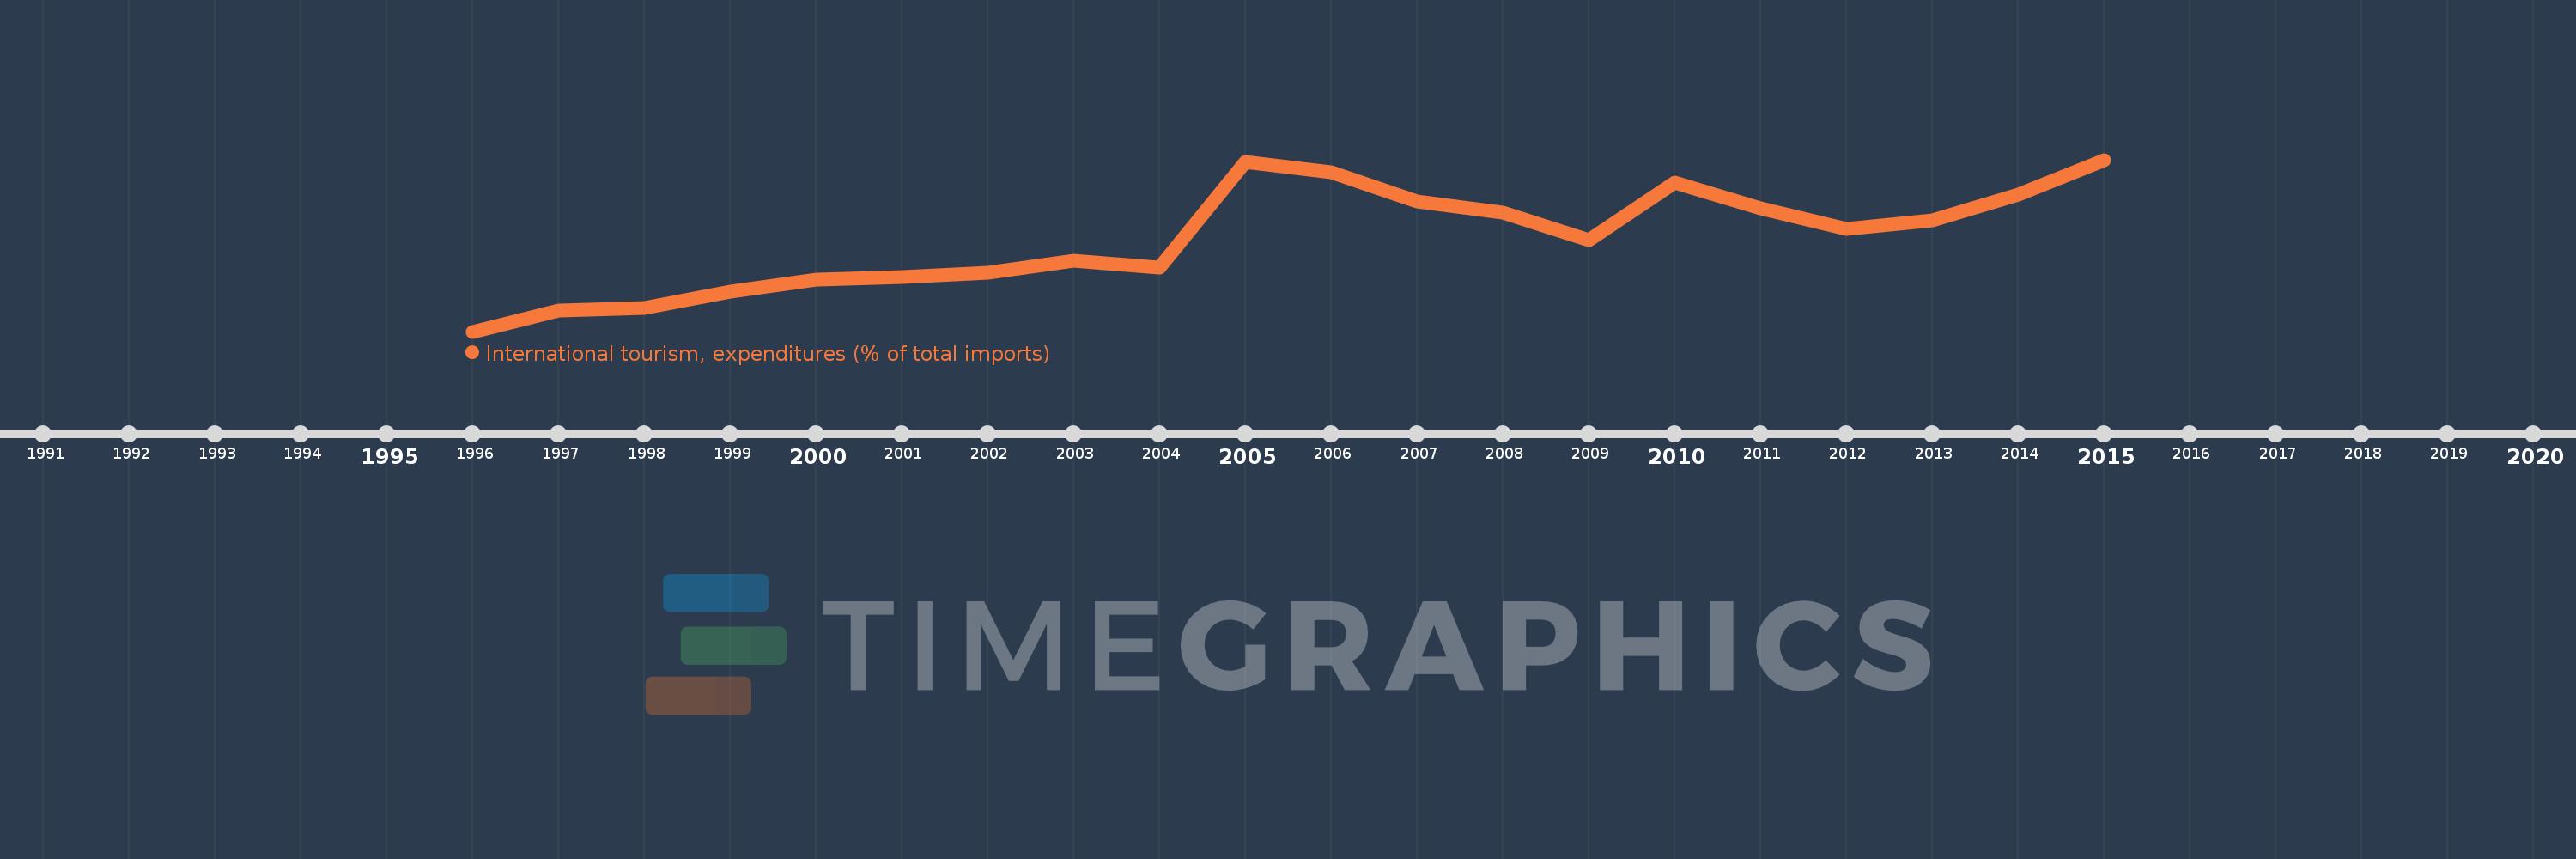
Questa scala temporale mostra un grafico dal 1996 anno al 2015 anno. Ukraine. I dati fino ad 1995 anno non disponibili. Il numero di osservazioni attuali secondo i date: 20.
La fonte (nome):
Indicatori dello sviluppo mondiale
La fonte (organizzazione):
World Tourism Organization, Yearbook of Tourism Statistics, Compendium of Tourism Statistics and data files, and IMF and World Bank imports estimates.
Categorie:
Private Sector, Trade
sono stati aggiornati
23 apr 2017 anni
Indicatori delle variazioni dei valori per anni
In media:
4.767
Minima:
1.219
1 gen 1996 anni
Massimo:
7.81
1 gen 2015 anni
Alla data di osservazione
Valore
Variazione assoluta
La variazione rispetto al valore precedente
1 gen 1996 anni
1.219
+1.219
0.0%
1 gen 1997 anni
2.04
+0.822
67.44%
1 gen 1998 anni
2.11
+0.07
3.44%
1 gen 1999 anni
2.736
+0.626
29.65%
1 gen 2000 anni
3.229
+0.492
18.0%
1 gen 2001 anni
3.315
+0.086
2.68%
1 gen 2002 anni
3.488
+0.173
5.21%
1 gen 2003 anni
3.938
+0.45
12.91%
1 gen 2004 anni
3.661
-0.277
-7.03%
1 gen 2005 anni
7.714
+4.053
110.71%
1 gen 2006 anni
7.337
-0.377
-4.89%
1 gen 2007 anni
6.227
-1.11
-15.13%
1 gen 2008 anni
5.783
-0.443
-7.12%
1 gen 2009 anni
4.734
-1.049
-18.14%
1 gen 2010 anni
6.942
+2.207
46.62%
1 gen 2011 anni
5.939
-1.003
-14.44%
1 gen 2012 anni
5.148
-0.791
-13.31%
1 gen 2013 anni
5.489
+0.34
6.61%
1 gen 2014 anni
6.471
+0.983
17.9%
1 gen 2015 anni
7.81
+1.338
20.68%
Classificazione dei paesi secondo i statistiche attuali per anni