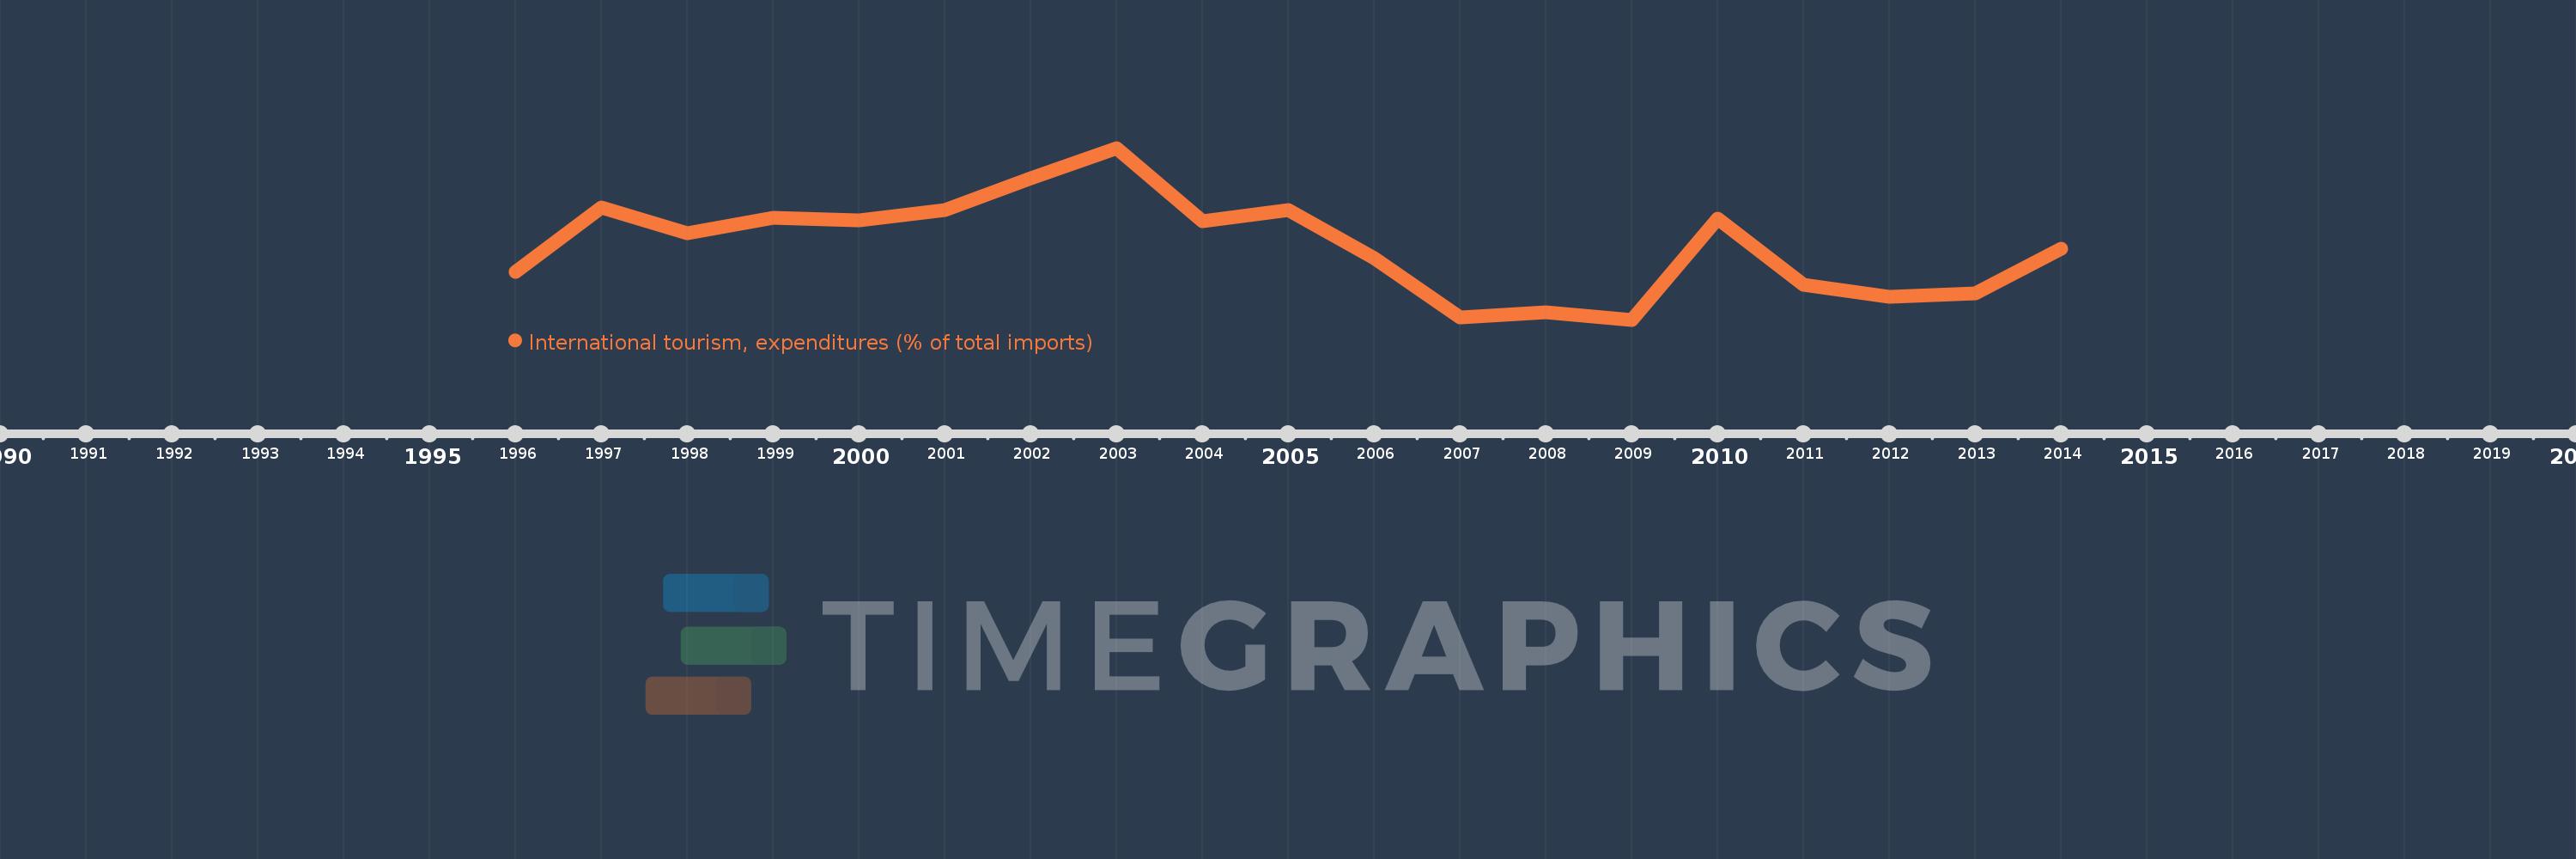
Questa scala temporale mostra un grafico dal 1996 anno al 2014 anno. St. Lucia. I dati fino ad 1995 anno non disponibili. Il numero di osservazioni attuali secondo i date: 19.
La fonte (nome):
Indicatori dello sviluppo mondiale
La fonte (organizzazione):
World Tourism Organization, Yearbook of Tourism Statistics, Compendium of Tourism Statistics and data files, and IMF and World Bank imports estimates.
Categorie:
Private Sector, Trade
sono stati aggiornati
23 apr 2017 anni
Indicatori delle variazioni dei valori per anni
In media:
6.776
Minima:
5.486
1 gen 2009 anni
Massimo:
8.48
1 gen 2003 anni
Alla data di osservazione
Valore
Variazione assoluta
La variazione rispetto al valore precedente
1 gen 1996 anni
6.316
+6.316
0.0%
1 gen 1997 anni
7.439
+1.123
17.78%
1 gen 1998 anni
7.0
-0.439
-5.9%
1 gen 1999 anni
7.256
+0.256
3.66%
1 gen 2000 anni
7.217
-0.038
-0.53%
1 gen 2001 anni
7.4
+0.183
2.53%
1 gen 2002 anni
7.946
+0.546
7.38%
1 gen 2003 anni
8.48
+0.533
6.71%
1 gen 2004 anni
7.204
-1.275
-15.04%
1 gen 2005 anni
7.396
+0.191
2.66%
1 gen 2006 anni
6.556
-0.839
-11.35%
1 gen 2007 anni
5.519
-1.038
-15.83%
1 gen 2008 anni
5.62
+0.101
1.83%
1 gen 2009 anni
5.486
-0.134
-2.38%
1 gen 2010 anni
7.254
+1.768
32.22%
1 gen 2011 anni
6.096
-1.158
-15.96%
1 gen 2012 anni
5.881
-0.215
-3.53%
1 gen 2013 anni
5.949
+0.068
1.16%
1 gen 2014 anni
6.724
+0.775
13.03%
Classificazione dei paesi secondo i statistiche attuali per anni