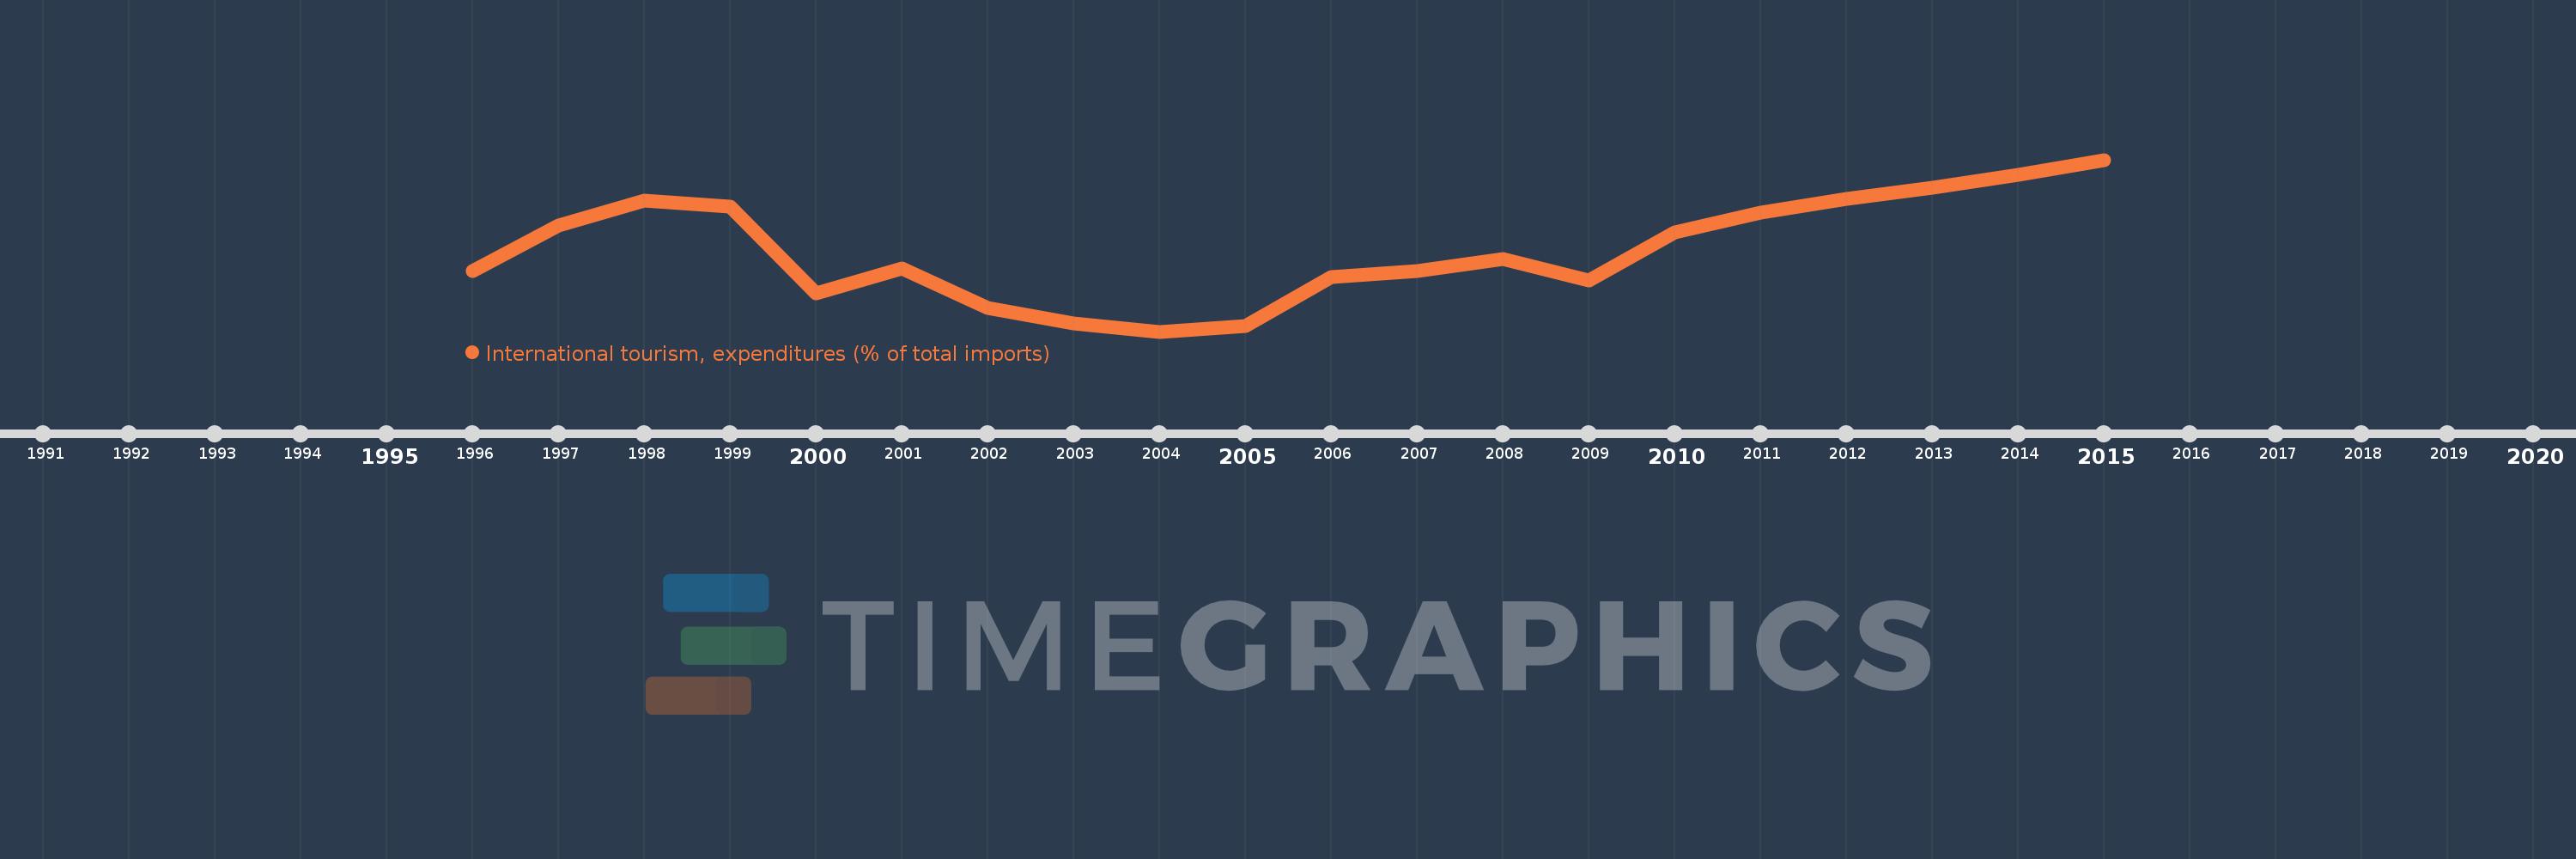
Questa scala temporale mostra un grafico dal 1996 anno al 2015 anno. Brazil. I dati fino ad 1995 anno non disponibili. Il numero di osservazioni attuali secondo i date: 20.
La fonte (nome):
Indicatori dello sviluppo mondiale
La fonte (organizzazione):
World Tourism Organization, Yearbook of Tourism Statistics, Compendium of Tourism Statistics and data files, and IMF and World Bank imports estimates.
Categorie:
Private Sector, Trade
sono stati aggiornati
23 apr 2017 anni
Indicatori delle variazioni dei valori per anni
In media:
6.864
Minima:
4.583
1 gen 2004 anni
Massimo:
9.41
1 gen 2015 anni
Alla data di osservazione
Valore
Variazione assoluta
La variazione rispetto al valore precedente
1 gen 1996 anni
6.291
+6.291
0.0%
1 gen 1997 anni
7.556
+1.264
20.09%
1 gen 1998 anni
8.262
+0.707
9.35%
1 gen 1999 anni
8.088
-0.174
-2.1%
1 gen 2000 anni
5.654
-2.435
-30.1%
1 gen 2001 anni
6.354
+0.7
12.38%
1 gen 2002 anni
5.256
-1.098
-17.27%
1 gen 2003 anni
4.819
-0.437
-8.32%
1 gen 2004 anni
4.583
-0.236
-4.9%
1 gen 2005 anni
4.75
+0.166
3.63%
1 gen 2006 anni
6.112
+1.362
28.69%
1 gen 2007 anni
6.277
+0.165
2.7%
1 gen 2008 anni
6.613
+0.336
5.35%
1 gen 2009 anni
6.025
-0.588
-8.89%
1 gen 2010 anni
7.382
+1.358
22.54%
1 gen 2011 anni
7.936
+0.554
7.5%
1 gen 2012 anni
8.301
+0.364
4.59%
1 gen 2013 anni
8.623
+0.323
3.89%
1 gen 2014 anni
8.983
+0.359
4.17%
1 gen 2015 anni
9.41
+0.427
4.75%
Classificazione dei paesi secondo i statistiche attuali per anni