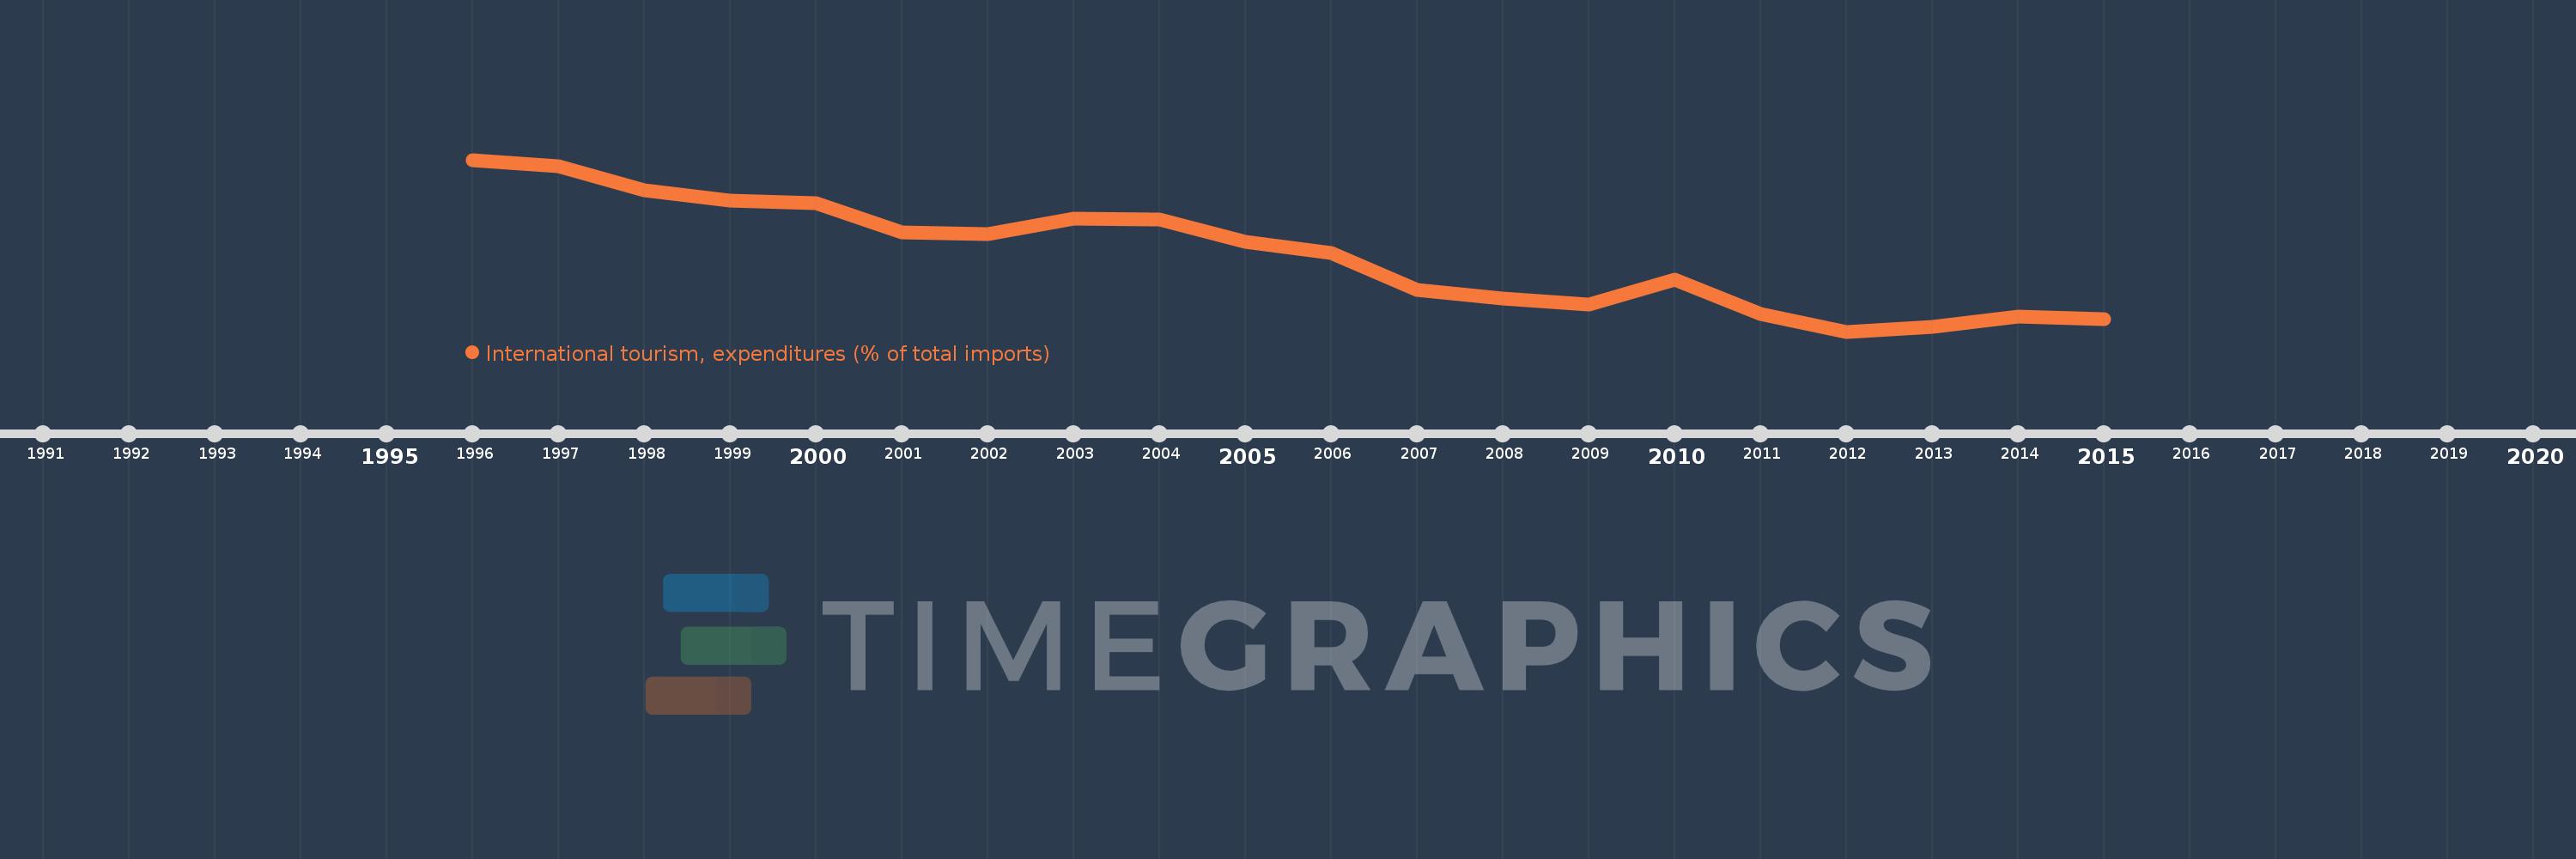
Questa scala temporale mostra un grafico dal 1996 anno al 2015 anno. Germany. I dati fino ad 1995 anno non disponibili. Il numero di osservazioni attuali secondo i date: 20.
La fonte (nome):
Indicatori dello sviluppo mondiale
La fonte (organizzazione):
World Tourism Organization, Yearbook of Tourism Statistics, Compendium of Tourism Statistics and data files, and IMF and World Bank imports estimates.
Categorie:
Private Sector, Trade
sono stati aggiornati
23 apr 2017 anni
Indicatori delle variazioni dei valori per anni
In media:
8.994
Minima:
6.649
1 gen 2012 anni
Massimo:
11.912
1 gen 1996 anni
Alla data di osservazione
Valore
Variazione assoluta
La variazione rispetto al valore precedente
1 gen 1996 anni
11.912
+11.912
0.0%
1 gen 1997 anni
11.705
-0.207
-1.74%
1 gen 1998 anni
10.988
-0.717
-6.13%
1 gen 1999 anni
10.673
-0.315
-2.86%
1 gen 2000 anni
10.577
-0.096
-0.9%
1 gen 2001 anni
9.679
-0.899
-8.5%
1 gen 2002 anni
9.623
-0.055
-0.57%
1 gen 2003 anni
10.103
+0.479
4.98%
1 gen 2004 anni
10.078
-0.024
-0.24%
1 gen 2005 anni
9.393
-0.686
-6.81%
1 gen 2006 anni
9.052
-0.34
-3.62%
1 gen 2007 anni
7.938
-1.115
-12.32%
1 gen 2008 anni
7.673
-0.264
-3.33%
1 gen 2009 anni
7.475
-0.198
-2.58%
1 gen 2010 anni
8.239
+0.764
10.21%
1 gen 2011 anni
7.177
-1.062
-12.89%
1 gen 2012 anni
6.649
-0.528
-7.36%
1 gen 2013 anni
6.806
+0.157
2.37%
1 gen 2014 anni
7.117
+0.311
4.57%
1 gen 2015 anni
7.024
-0.093
-1.3%
Classificazione dei paesi secondo i statistiche attuali per anni