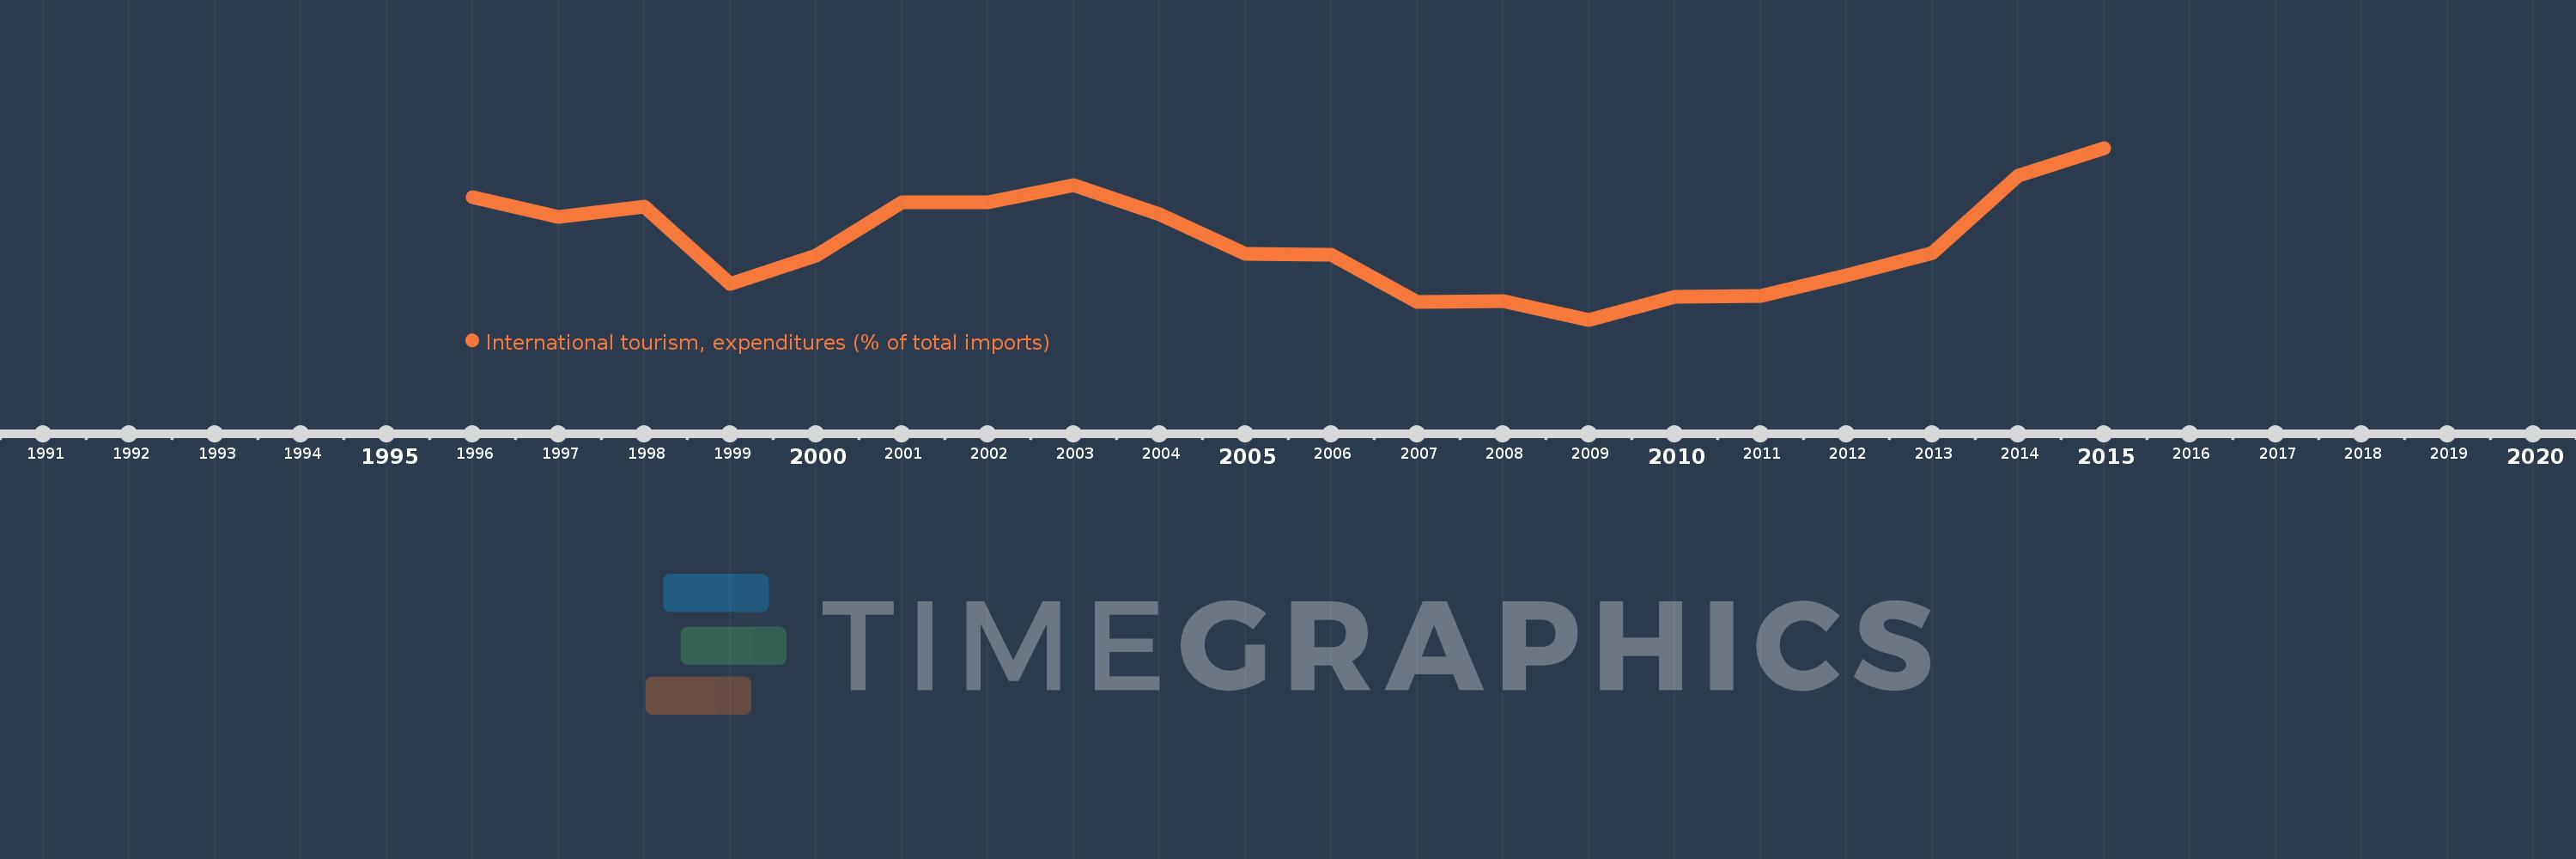
Questa scala temporale mostra un grafico dal 1996 anno al 2015 anno. Uruguay. I dati fino ad 1995 anno non disponibili. Il numero di osservazioni attuali secondo i date: 20.
La fonte (nome):
Indicatori dello sviluppo mondiale
La fonte (organizzazione):
World Tourism Organization, Yearbook of Tourism Statistics, Compendium of Tourism Statistics and data files, and IMF and World Bank imports estimates.
Categorie:
Private Sector, Trade
sono stati aggiornati
23 apr 2017 anni
Indicatori delle variazioni dei valori per anni
In media:
7.54
Minima:
4.51
1 gen 2009 anni
Massimo:
11.219
1 gen 2015 anni
Alla data di osservazione
Valore
Variazione assoluta
La variazione rispetto al valore precedente
1 gen 1996 anni
9.304
+9.304
0.0%
1 gen 1997 anni
8.53
-0.775
-8.32%
1 gen 1998 anni
8.915
+0.385
4.51%
1 gen 1999 anni
5.909
-3.006
-33.72%
1 gen 2000 anni
7.018
+1.11
18.78%
1 gen 2001 anni
9.087
+2.069
29.48%
1 gen 2002 anni
9.082
-0.005
-0.05%
1 gen 2003 anni
9.752
+0.669
7.37%
1 gen 2004 anni
8.632
-1.12
-11.48%
1 gen 2005 anni
7.067
-1.565
-18.13%
1 gen 2006 anni
7.053
-0.013
-0.19%
1 gen 2007 anni
5.19
-1.864
-26.42%
1 gen 2008 anni
5.225
+0.035
0.68%
1 gen 2009 anni
4.51
-0.715
-13.68%
1 gen 2010 anni
5.396
+0.887
19.66%
1 gen 2011 anni
5.442
+0.045
0.84%
1 gen 2012 anni
6.249
+0.807
14.83%
1 gen 2013 anni
7.101
+0.852
13.63%
1 gen 2014 anni
10.129
+3.028
42.64%
1 gen 2015 anni
11.219
+1.09
10.76%
Classificazione dei paesi secondo i statistiche attuali per anni