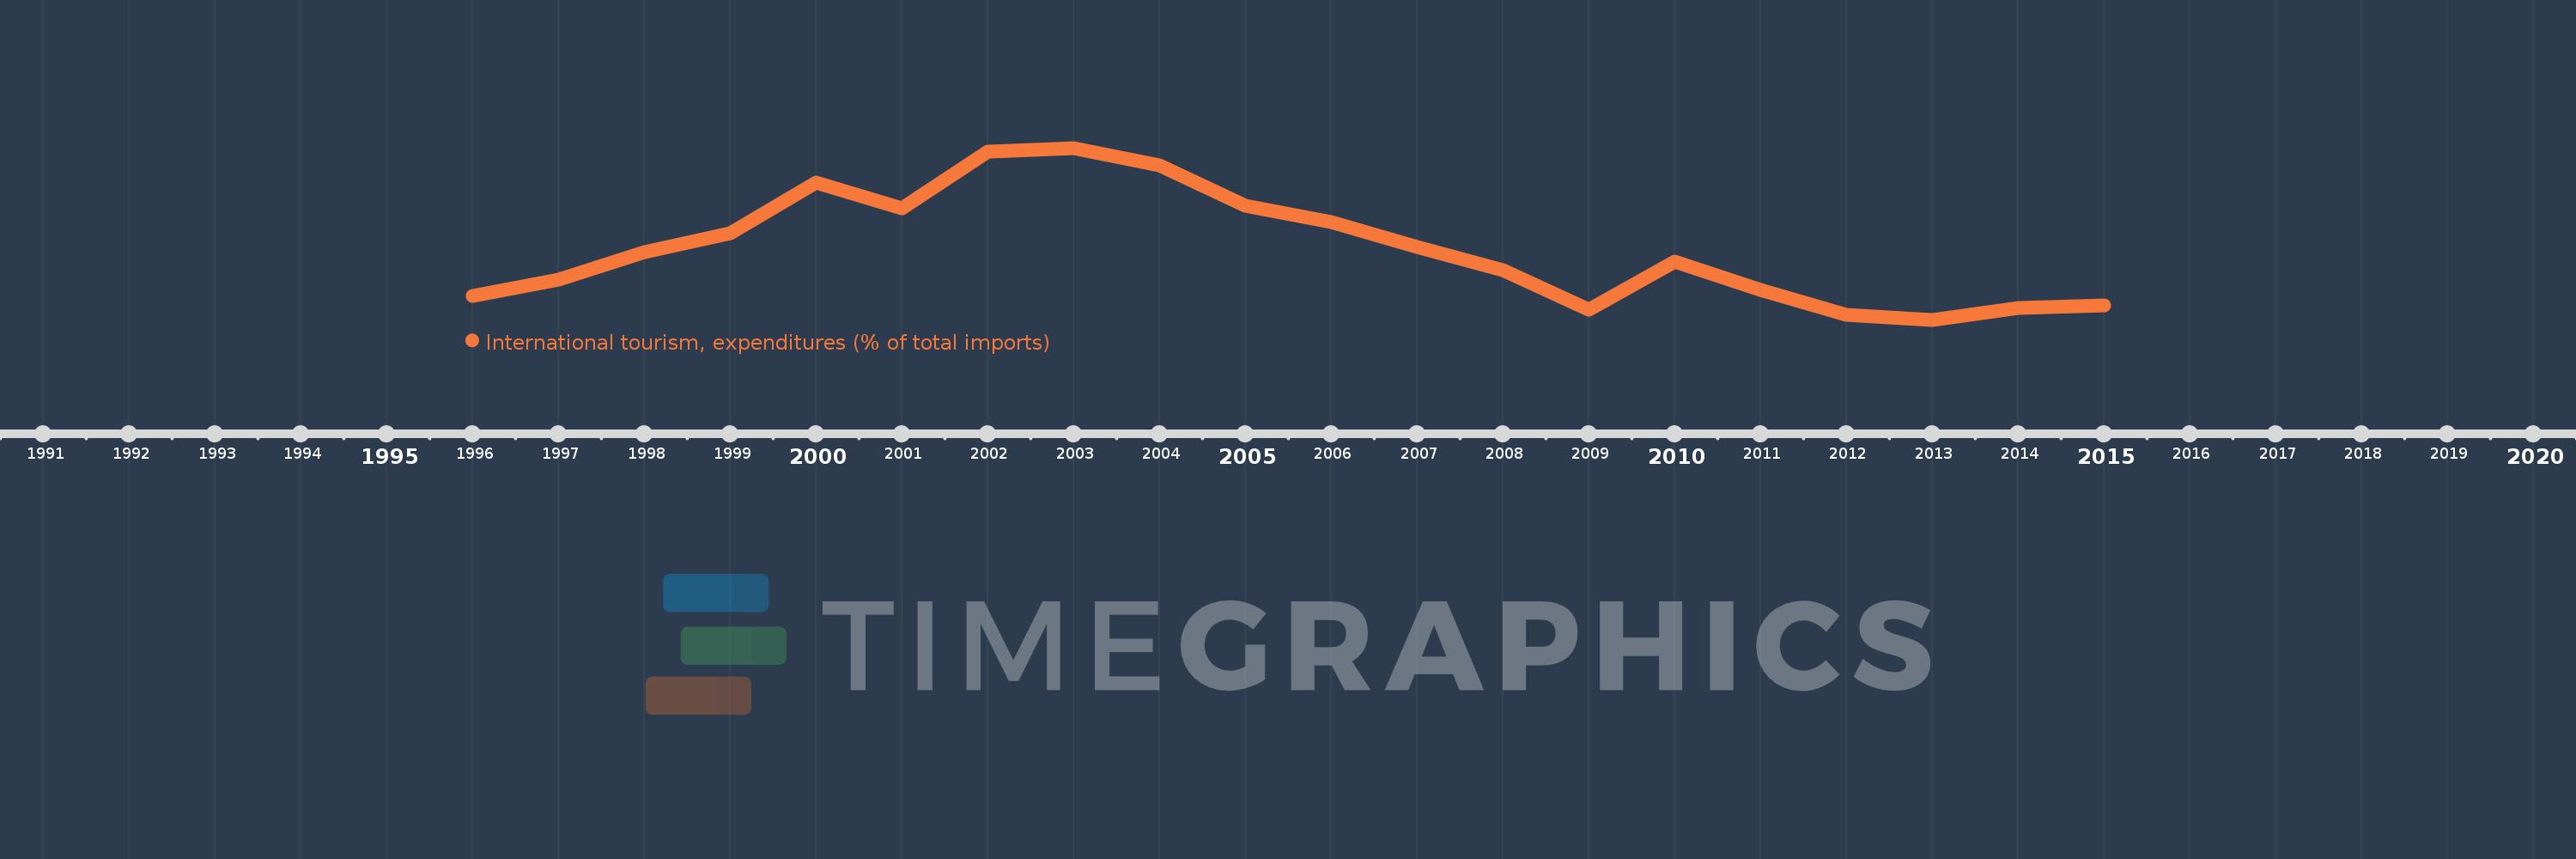
Questa scala temporale mostra un grafico dal 1996 anno al 2015 anno. Peru. I dati fino ad 1995 anno non disponibili. Il numero di osservazioni attuali secondo i date: 20.
La fonte (nome):
Indicatori dello sviluppo mondiale
La fonte (organizzazione):
World Tourism Organization, Yearbook of Tourism Statistics, Compendium of Tourism Statistics and data files, and IMF and World Bank imports estimates.
Categorie:
Private Sector, Trade
sono stati aggiornati
23 apr 2017 anni
Indicatori delle variazioni dei valori per anni
In media:
5.821
Minima:
3.99
1 gen 2013 anni
Massimo:
8.416
1 gen 2003 anni
Alla data di osservazione
Valore
Variazione assoluta
La variazione rispetto al valore precedente
1 gen 1996 anni
4.603
+4.603
0.0%
1 gen 1997 anni
5.032
+0.429
9.32%
1 gen 1998 anni
5.724
+0.692
13.75%
1 gen 1999 anni
6.215
+0.49
8.57%
1 gen 2000 anni
7.523
+1.308
21.05%
1 gen 2001 anni
6.861
-0.662
-8.8%
1 gen 2002 anni
8.314
+1.452
21.17%
1 gen 2003 anni
8.416
+0.103
1.24%
1 gen 2004 anni
7.966
-0.45
-5.35%
1 gen 2005 anni
6.918
-1.048
-13.16%
1 gen 2006 anni
6.497
-0.421
-6.08%
1 gen 2007 anni
5.857
-0.64
-9.86%
1 gen 2008 anni
5.264
-0.593
-10.12%
1 gen 2009 anni
4.238
-1.027
-19.5%
1 gen 2010 anni
5.479
+1.241
29.29%
1 gen 2011 anni
4.763
-0.716
-13.07%
1 gen 2012 anni
4.115
-0.647
-13.59%
1 gen 2013 anni
3.99
-0.125
-3.05%
1 gen 2014 anni
4.286
+0.296
7.42%
1 gen 2015 anni
4.366
+0.08
1.87%
Classificazione dei paesi secondo i statistiche attuali per anni